
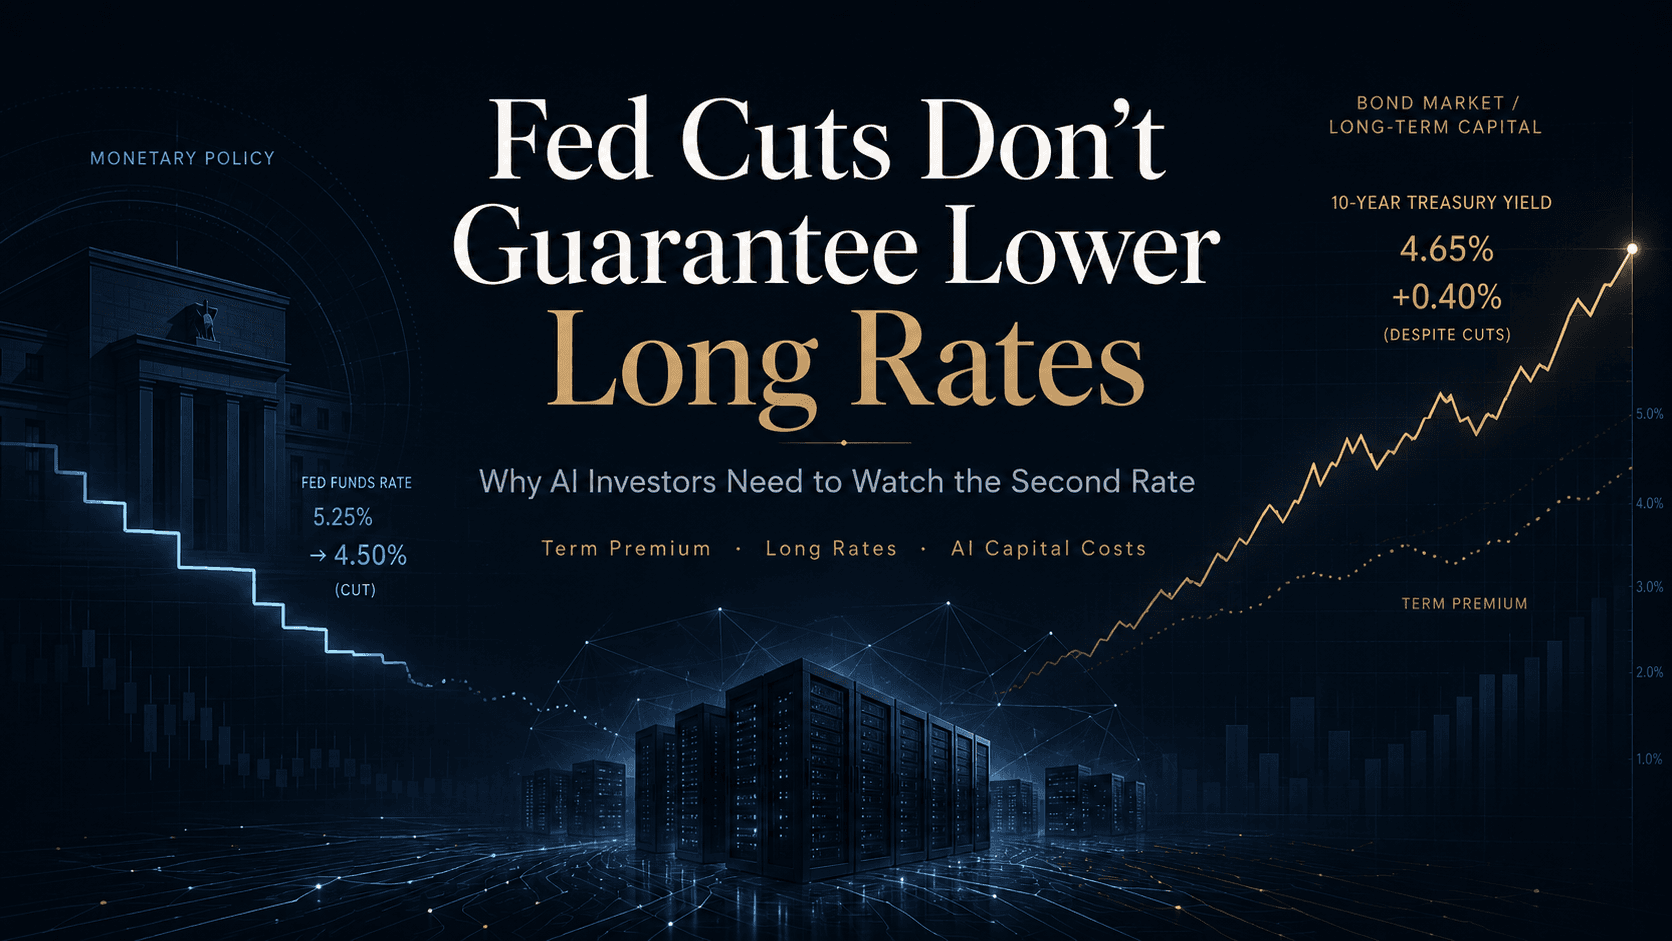
Long-term interest rates driven up by term premiums; AI companies face both discount rates and financing costs simultaneously
Term Premium
AI investment
issuance of government bonds
AI Capex
Valuation
2026.08.25
Not long ago, while summarizing the U.S. CPI and PPI, I wrote quite a lengthy discussion about interest rates . It followed the familiar path: once inflation is under control, the Fed takes action, the discount rate falls, and this creates a favorable environment for AI stocks. I still do not believe that logic is wrong. However, while re-examining the past two months of U.S. bond data, I noticed something odd. While the market's forecast for future short-term rates had actually fallen slightly, the 10-year yield had risen by nearly 28 basis points. If the Fed didn't raise it, what caused the increase? This question seems more important than expected for those currently holding AI stocks.
For a case study of inflation news and market reactions, see why AI stocks rose after the CPI release, which examines oil prices, company results and Treasury yields together.
What we call “interest rates” is actually not just one thing.
The discount rate that directly influences the valuation of AI companies is not determined solely by the Fed's benchmark rate . Long-term interest rates reflect not only expectations regarding the Fed's policy path but also the term premium. While most people think of the benchmark rate when hearing about interest rates in the news, the actual discount rate is the long-term rate, which combines these two.
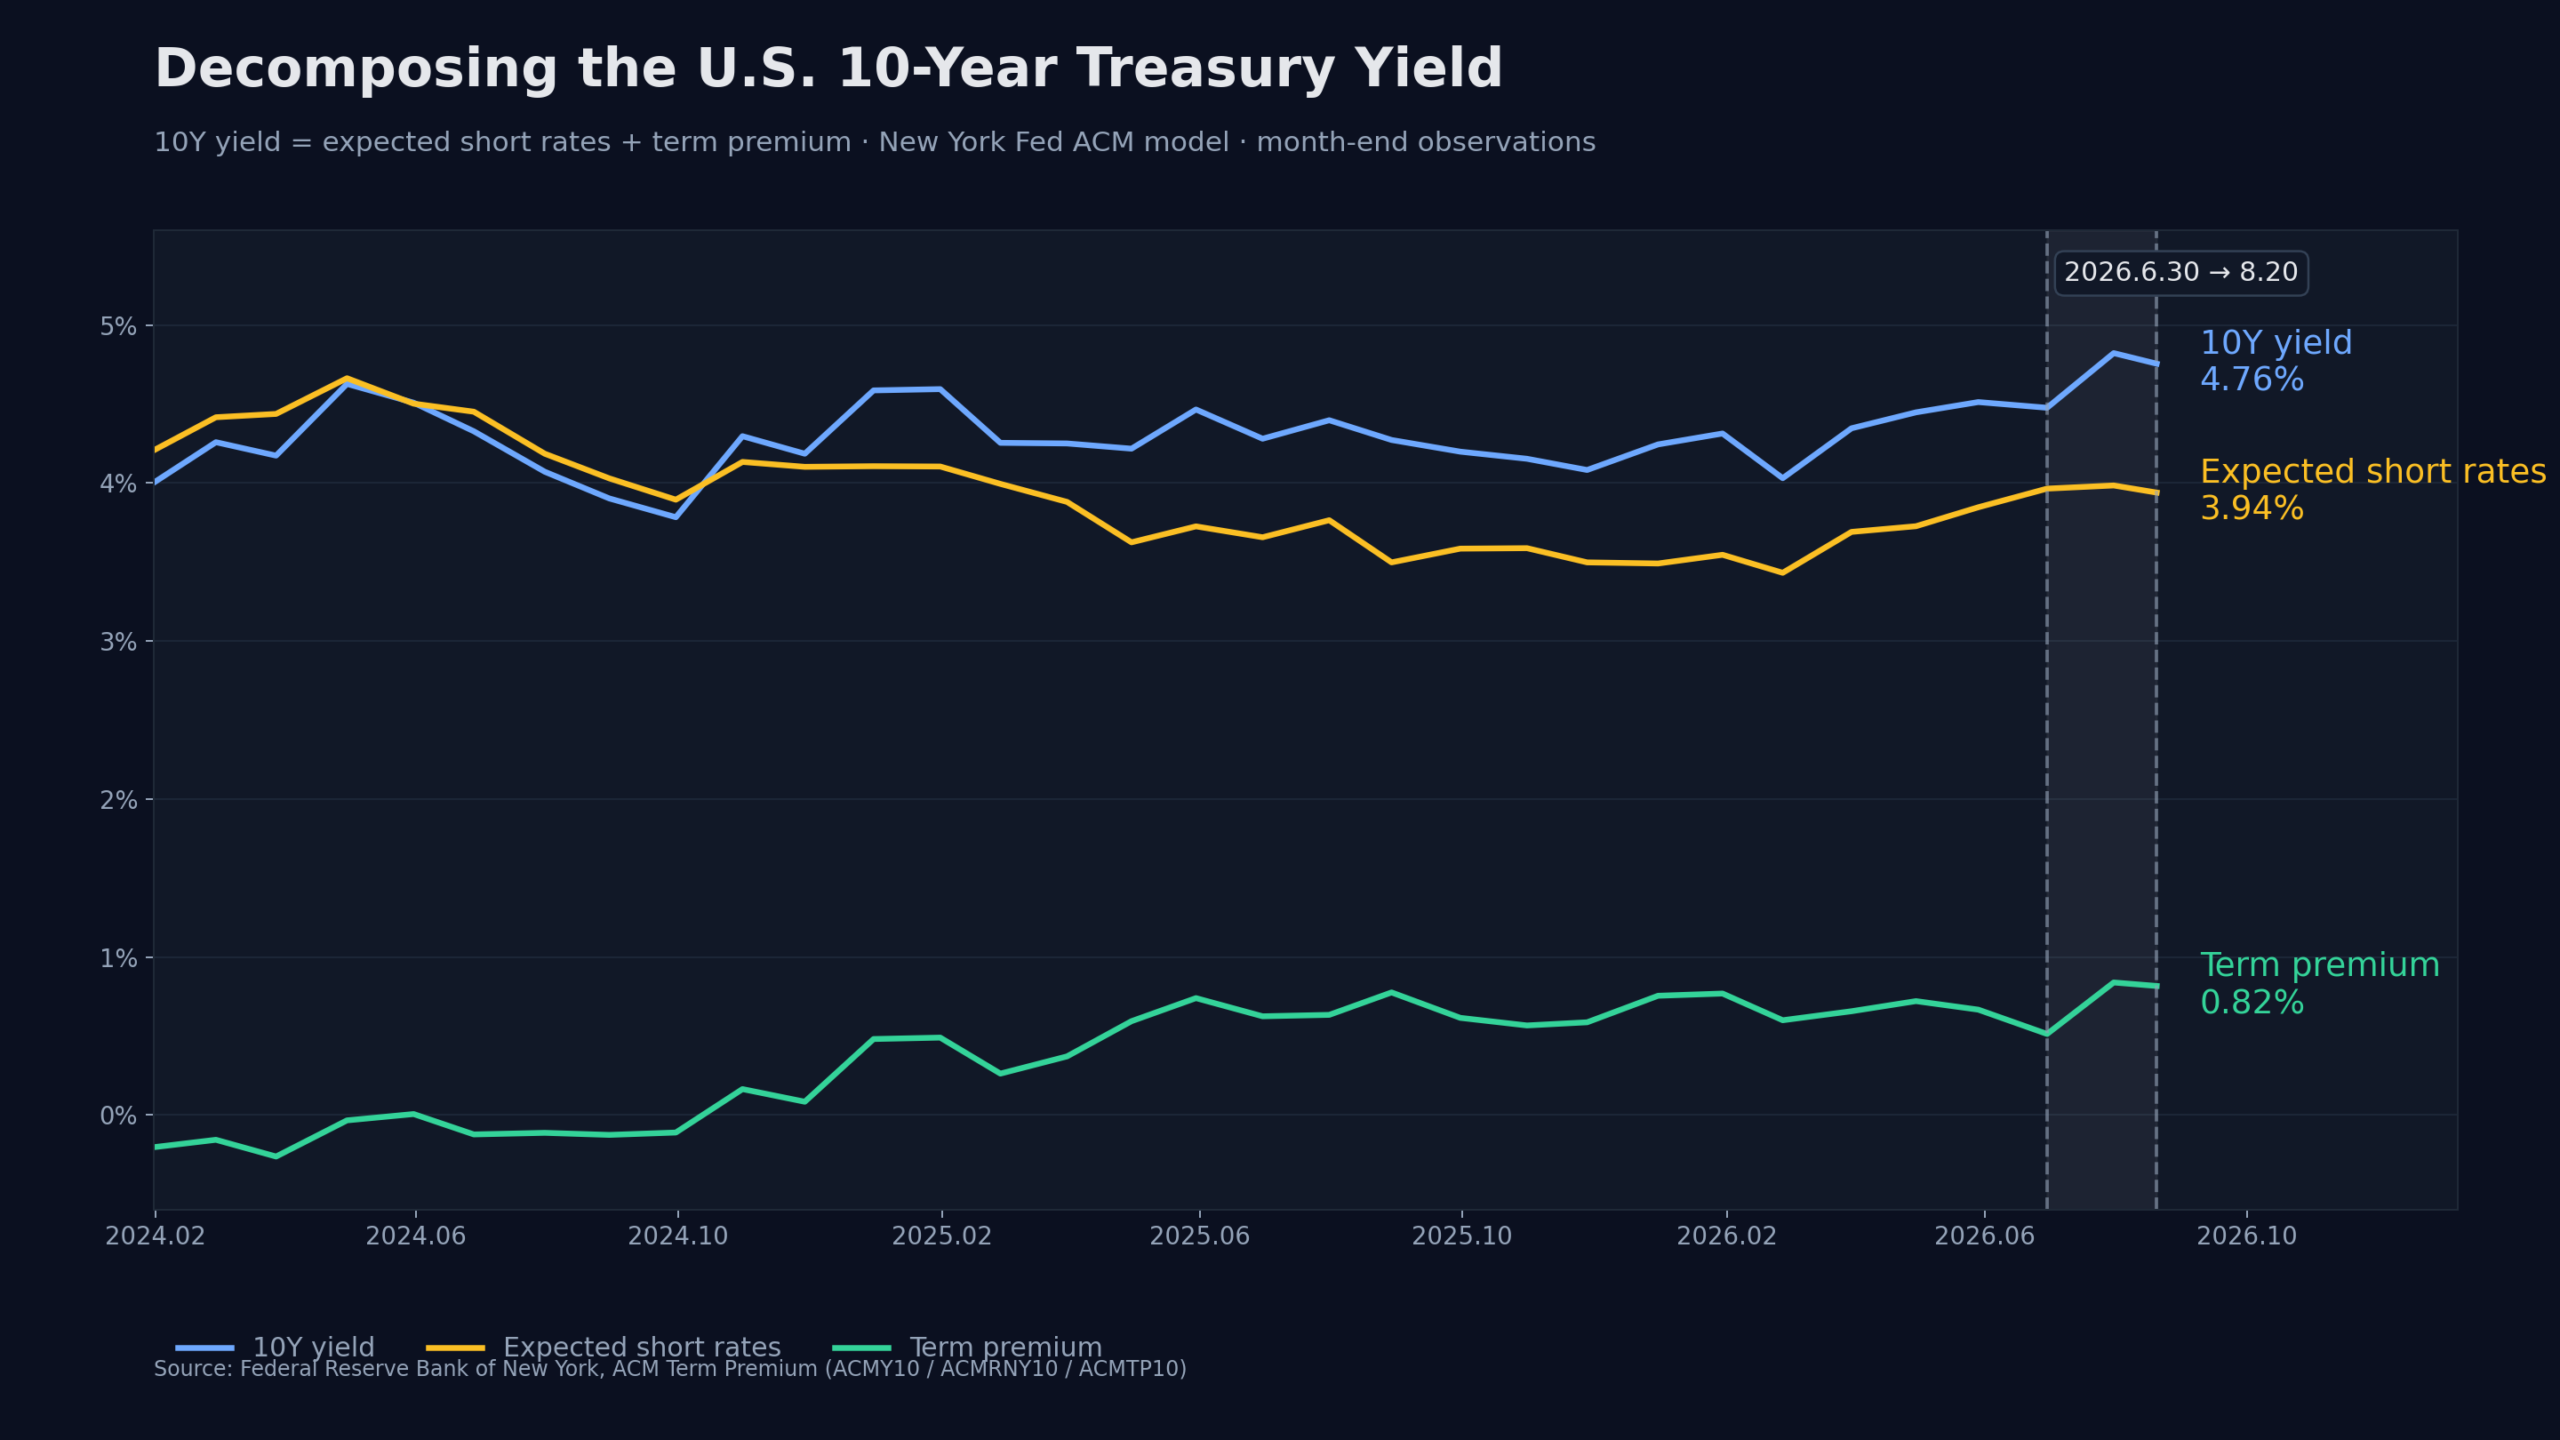
The U.S. 10-year Treasury yield can be simplified and divided into two parts: the 10-year yield ≈ expectations for future short-term interest rates + the term premium . The former is the market's average expectation regarding at what level the Fed will raise the benchmark interest rate in the future.
The term "Term Premium" mentioned later is a somewhat unfamiliar concept. From the perspective of the lender, there is no way to know what might happen over a 10-year period. Inflation could rise again, government bonds could flood the market much more than expected, or interest rates themselves could fluctuate significantly. The additional compensation demanded in exchange for accepting that uncertainty is the Term Premium.
The New York Fed uses the ACM (Adrian-Crump-Moench) model to divide U.S. Treasury yields into these two segments and releases daily estimates. Decomposing recent data using this method yields some interesting results.
As recently as the second half of 2024, the 10-year term premium was near 0% or negative. However, it rose into positive territory as 2025 passed, maintained a high level in 2026, and recently surged again. The direction becomes much clearer, particularly when looking at just the last two months.
2It Was Not the Fed That Raised Interest Rates in the Last Two Months
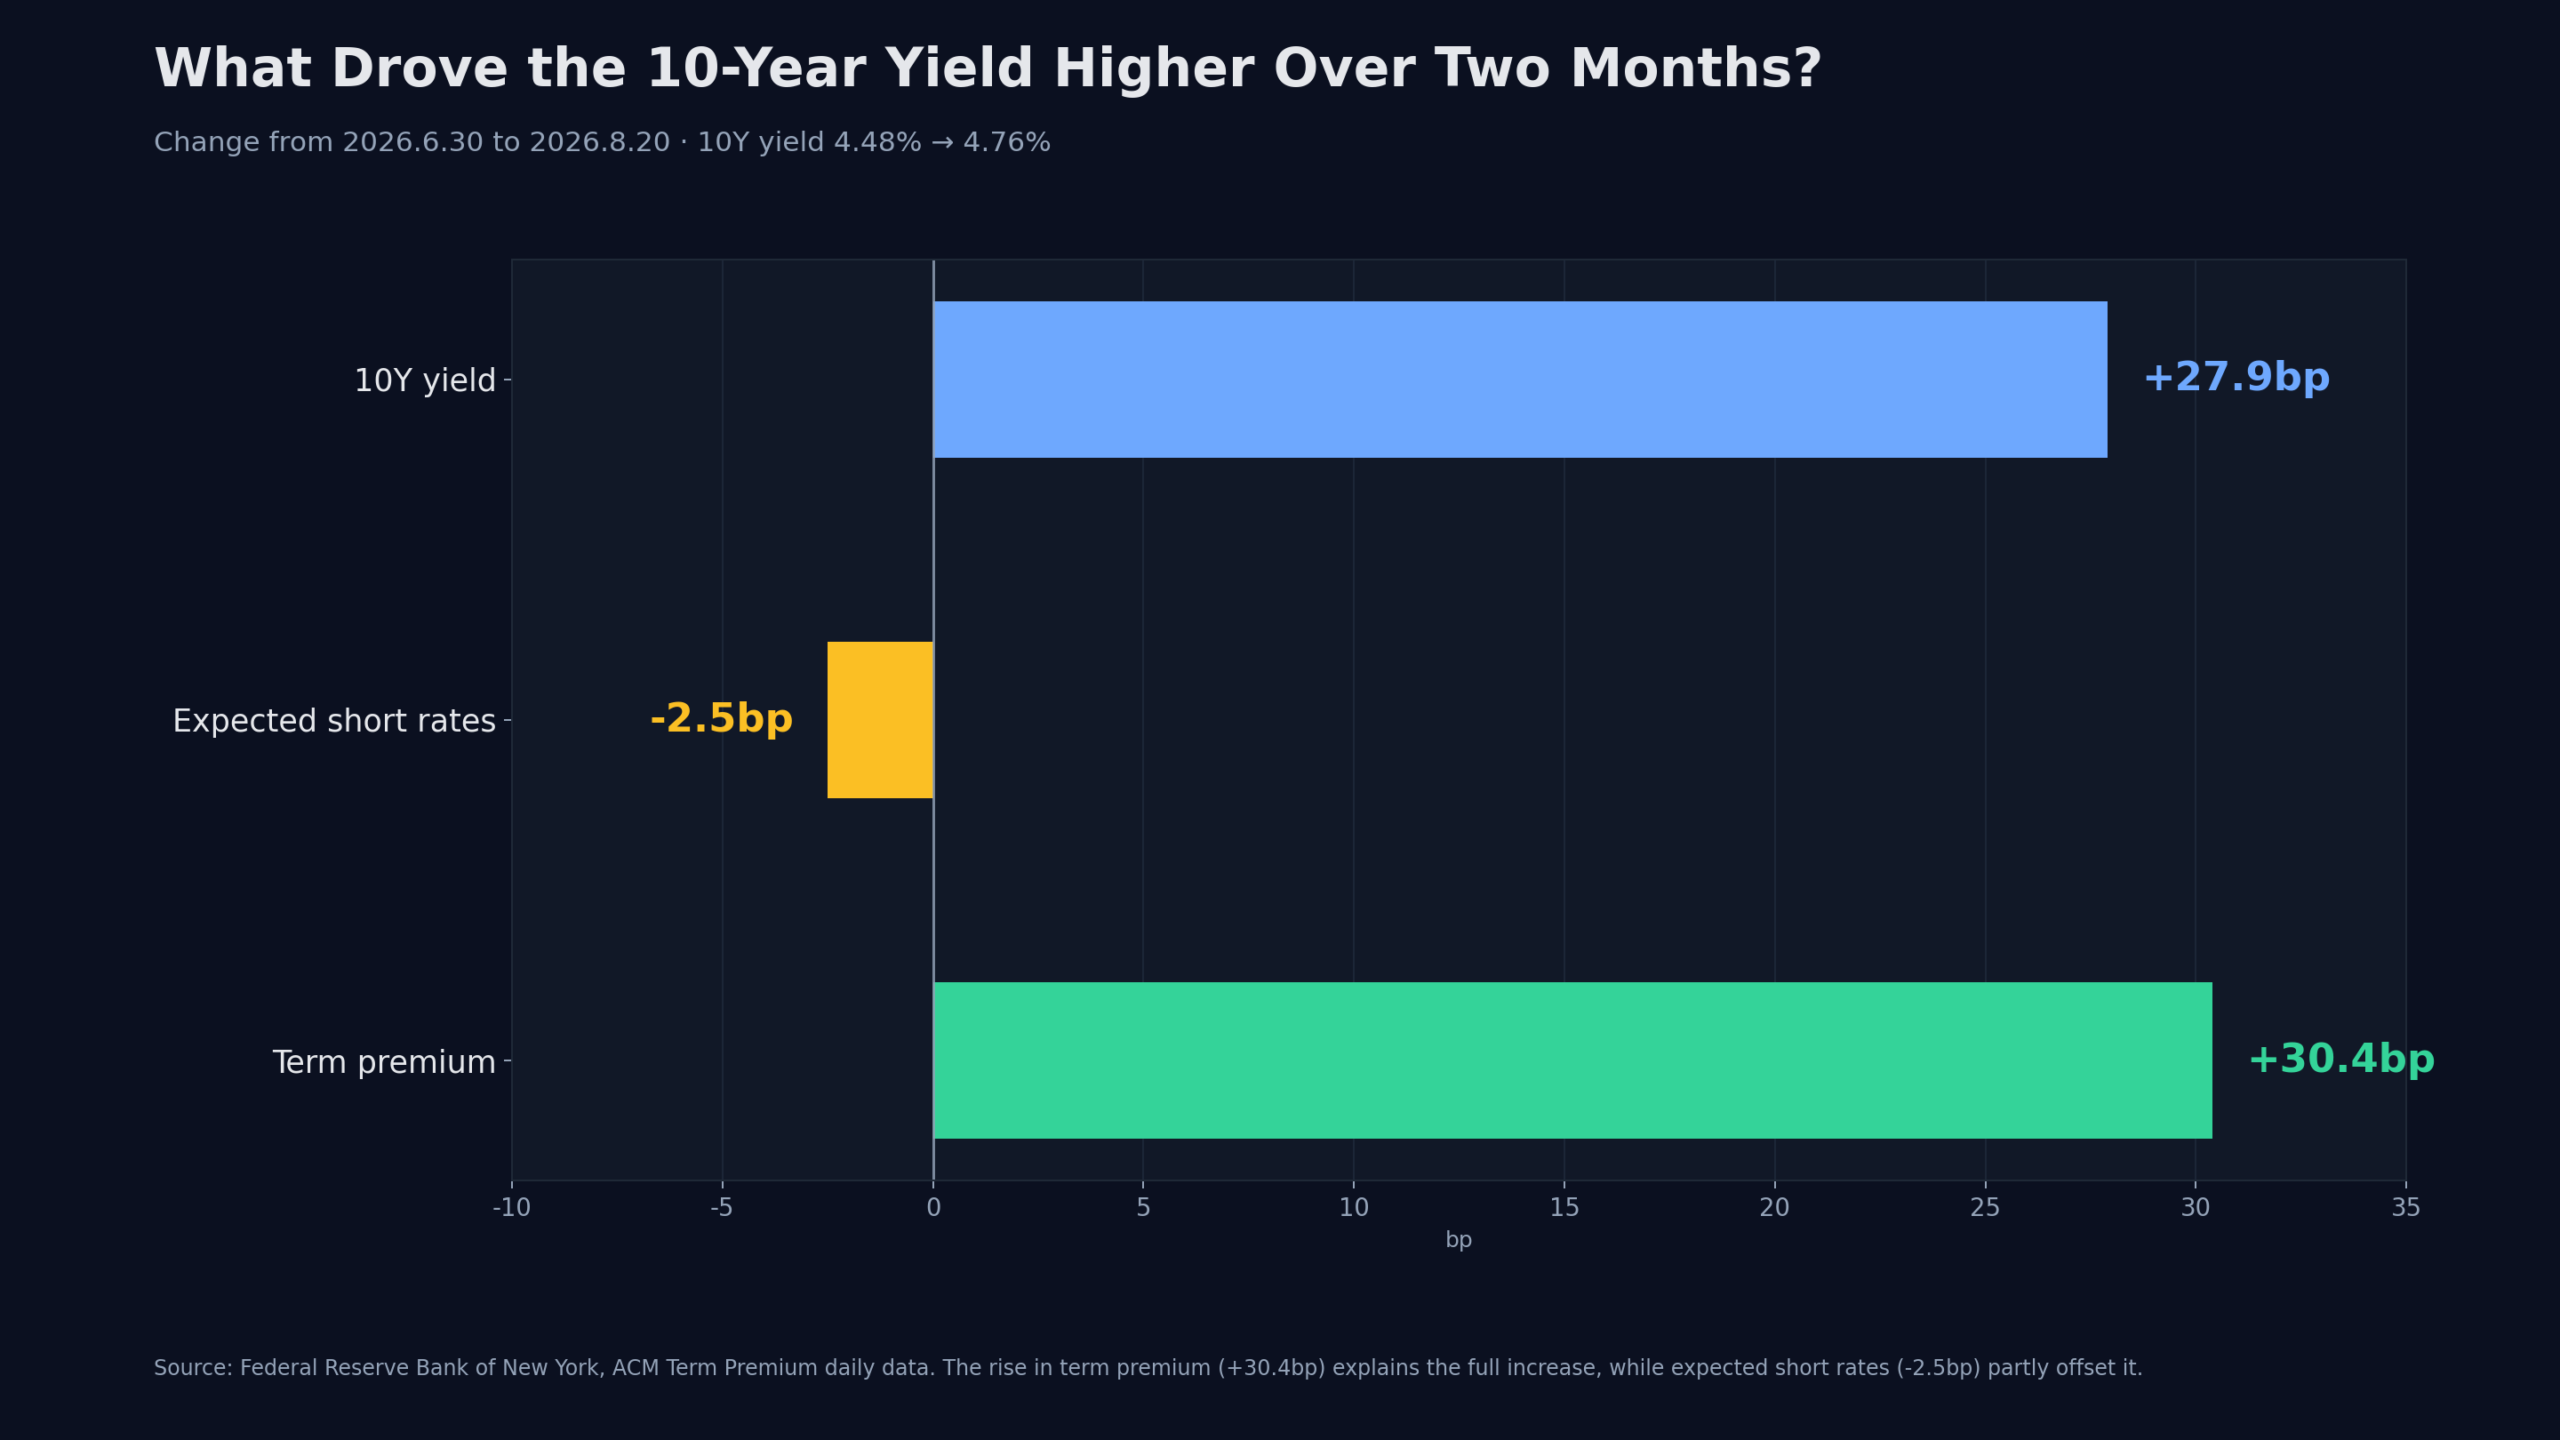
The increase in the U.S. 10-year Treasury yield between June 30 and August 20 was virtually entirely due to the Term Premium. According to ACM, the 10-year yield, which was approximately 4.48% at the end of June, rose to approximately 4.76% on August 20. This represents an increase of 27.9 basis points , or 0.28 percentage points, over two months.
At first glance, it is easy to interpret this as the market starting to think the Fed will keep interest rates high for longer. However, a closer look reveals the exact opposite.
Expectations for future short-term interest rates actually fell by 2.5 basis points . Instead, the term premium rose by 30.4 basis points , pulling long-term interest rates up.
The market did not demand higher interest rates on long-term bonds because it anticipated that Fed rates would rise further. Rather, it began demanding greater compensation for the very act of holding U.S. Treasury bonds for an extended period.
The reason this difference is important is that even if prices fall and the Fed actually cuts interest rates, long-term interest rates may not fall as much as expected if the Term Premium continues to rise.
On August 18, the yield on U.S. 30-year Treasuries touched 5.3% during trading. The following day, August 19, the U.S. Treasury Department announced that it would more than double the size of liquidity support buybacks for long-term bonds, increasing the maximum buyback amount from $2 billion to a minimum of $4 billion per buyback. The buybacks cover the 10-20 and 20-30 year maturities and will take effect on September 9.
The bond market reacted immediately that day. Between the 18th and the 19th, the ACM 10-year yield fell by about 6.8 basis points , while expectations for future short-term rates actually rose by about 3.1 basis points. Instead, the term premium fell by about 9.9 basis points . The reason long-term rates fell that day was not due to a change in expectations regarding the Fed, but because demand for risk compensation decreased.
However, the next day, the market reverted. While expectations remained almost unchanged, the Term Premium rebounded by about 4.4 basis points, and the 10-year yield also rose again by about 4.5 basis points. This means that while the Treasury Department's measures temporarily calmed the market, they failed to eliminate the structure that pushes long-term interest rates up.
The controversy surrounding buybacks is also intensifying. On August 25, Stanley Druckenmiller criticized the move, stating that such intervention could damage market confidence and that the issue of long-term interest rates should be resolved through improvements in fiscal structure. While this is merely one investor's assessment and not a verified conclusion, it illustrates what the key issues are in the current bond market.
3 The U.S. government must continue to borrow
When explaining the Term Premium, the first thing that comes up is U.S. finance. However, it is necessary to distinguish the numbers accurately here.
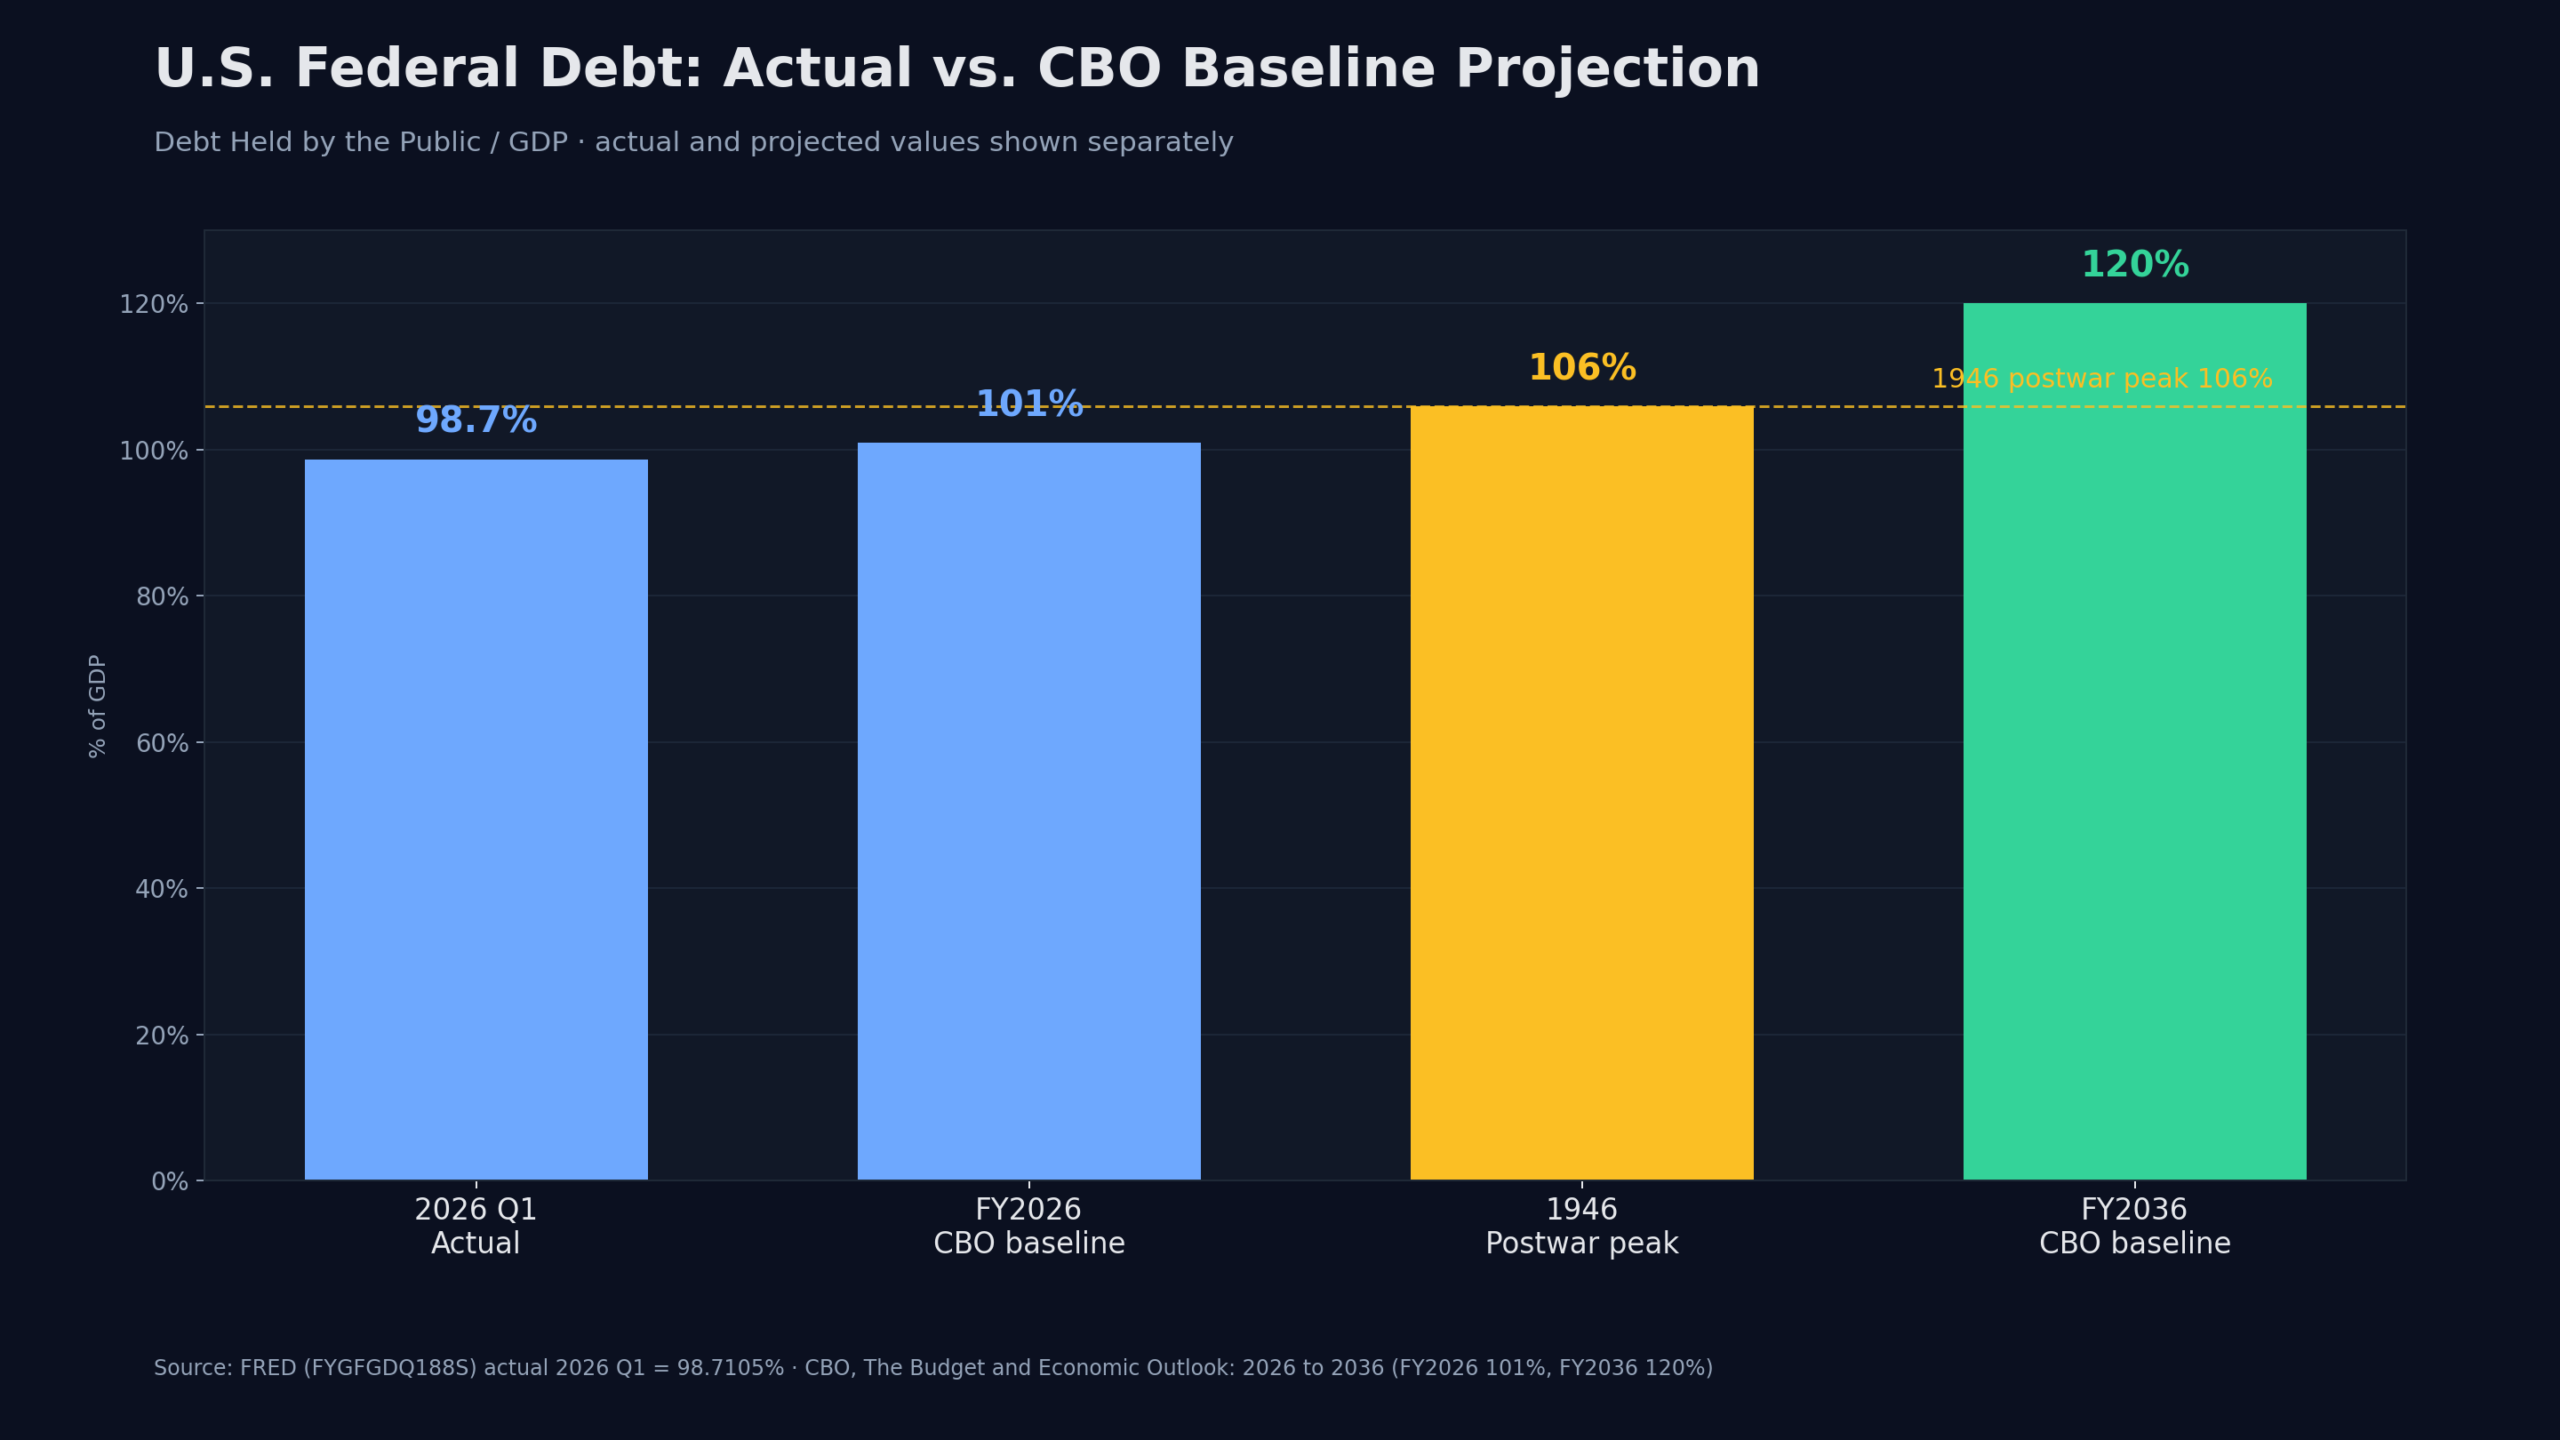
The "U.S. national debt" commonly referred to in the news is not the same concept as the government debt that financial markets actually need to absorb. What this article examines is "Debt Held by the Public" —that is, the federal debt actually held by the private sector and financial markets, rather than the government's internal accounts.
The Congressional Budget Office (CBO) projects that this debt will rise to 101% of GDP in 2026 and 120% in 2036. According to the same data, the fiscal deficit in 2026 is approximately $1.9 trillion , or 5.8% of GDP, and increases to $3.1 trillion by 2036.
A figure worth noting is interest. The CBO projects that the federal government's net interest expense will rise from 3.3% of GDP to 4.6% by 2036. All other things being equal, higher interest rates lead to greater interest expenditures, which in turn increases the need for additional borrowing. Of course, the government also has room to respond using tax revenues, expenditures, and cash balances.
However, we must not skip a step here. We cannot conclude based solely on current data that "the Term Premium has risen because the U.S. government has taken on a lot of debt." The Term Premium reflects not only the supply of government bonds but also inflation uncertainty, interest rate volatility, the Fed's balance sheet, demand for bonds from foreign investors, and geopolitical risks simultaneously. In particular, we are currently in a phase where tensions surrounding Iran and high oil prices are once again amplifying inflation uncertainty.
To be more precise, the situation is as follows. The U.S. structural fiscal deficit and the burden of government bond supply are one of the important factors that can explain the recent long-term bond risk premium. However, they are not the only cause.
4 The U.S. government is not the only place that needs money
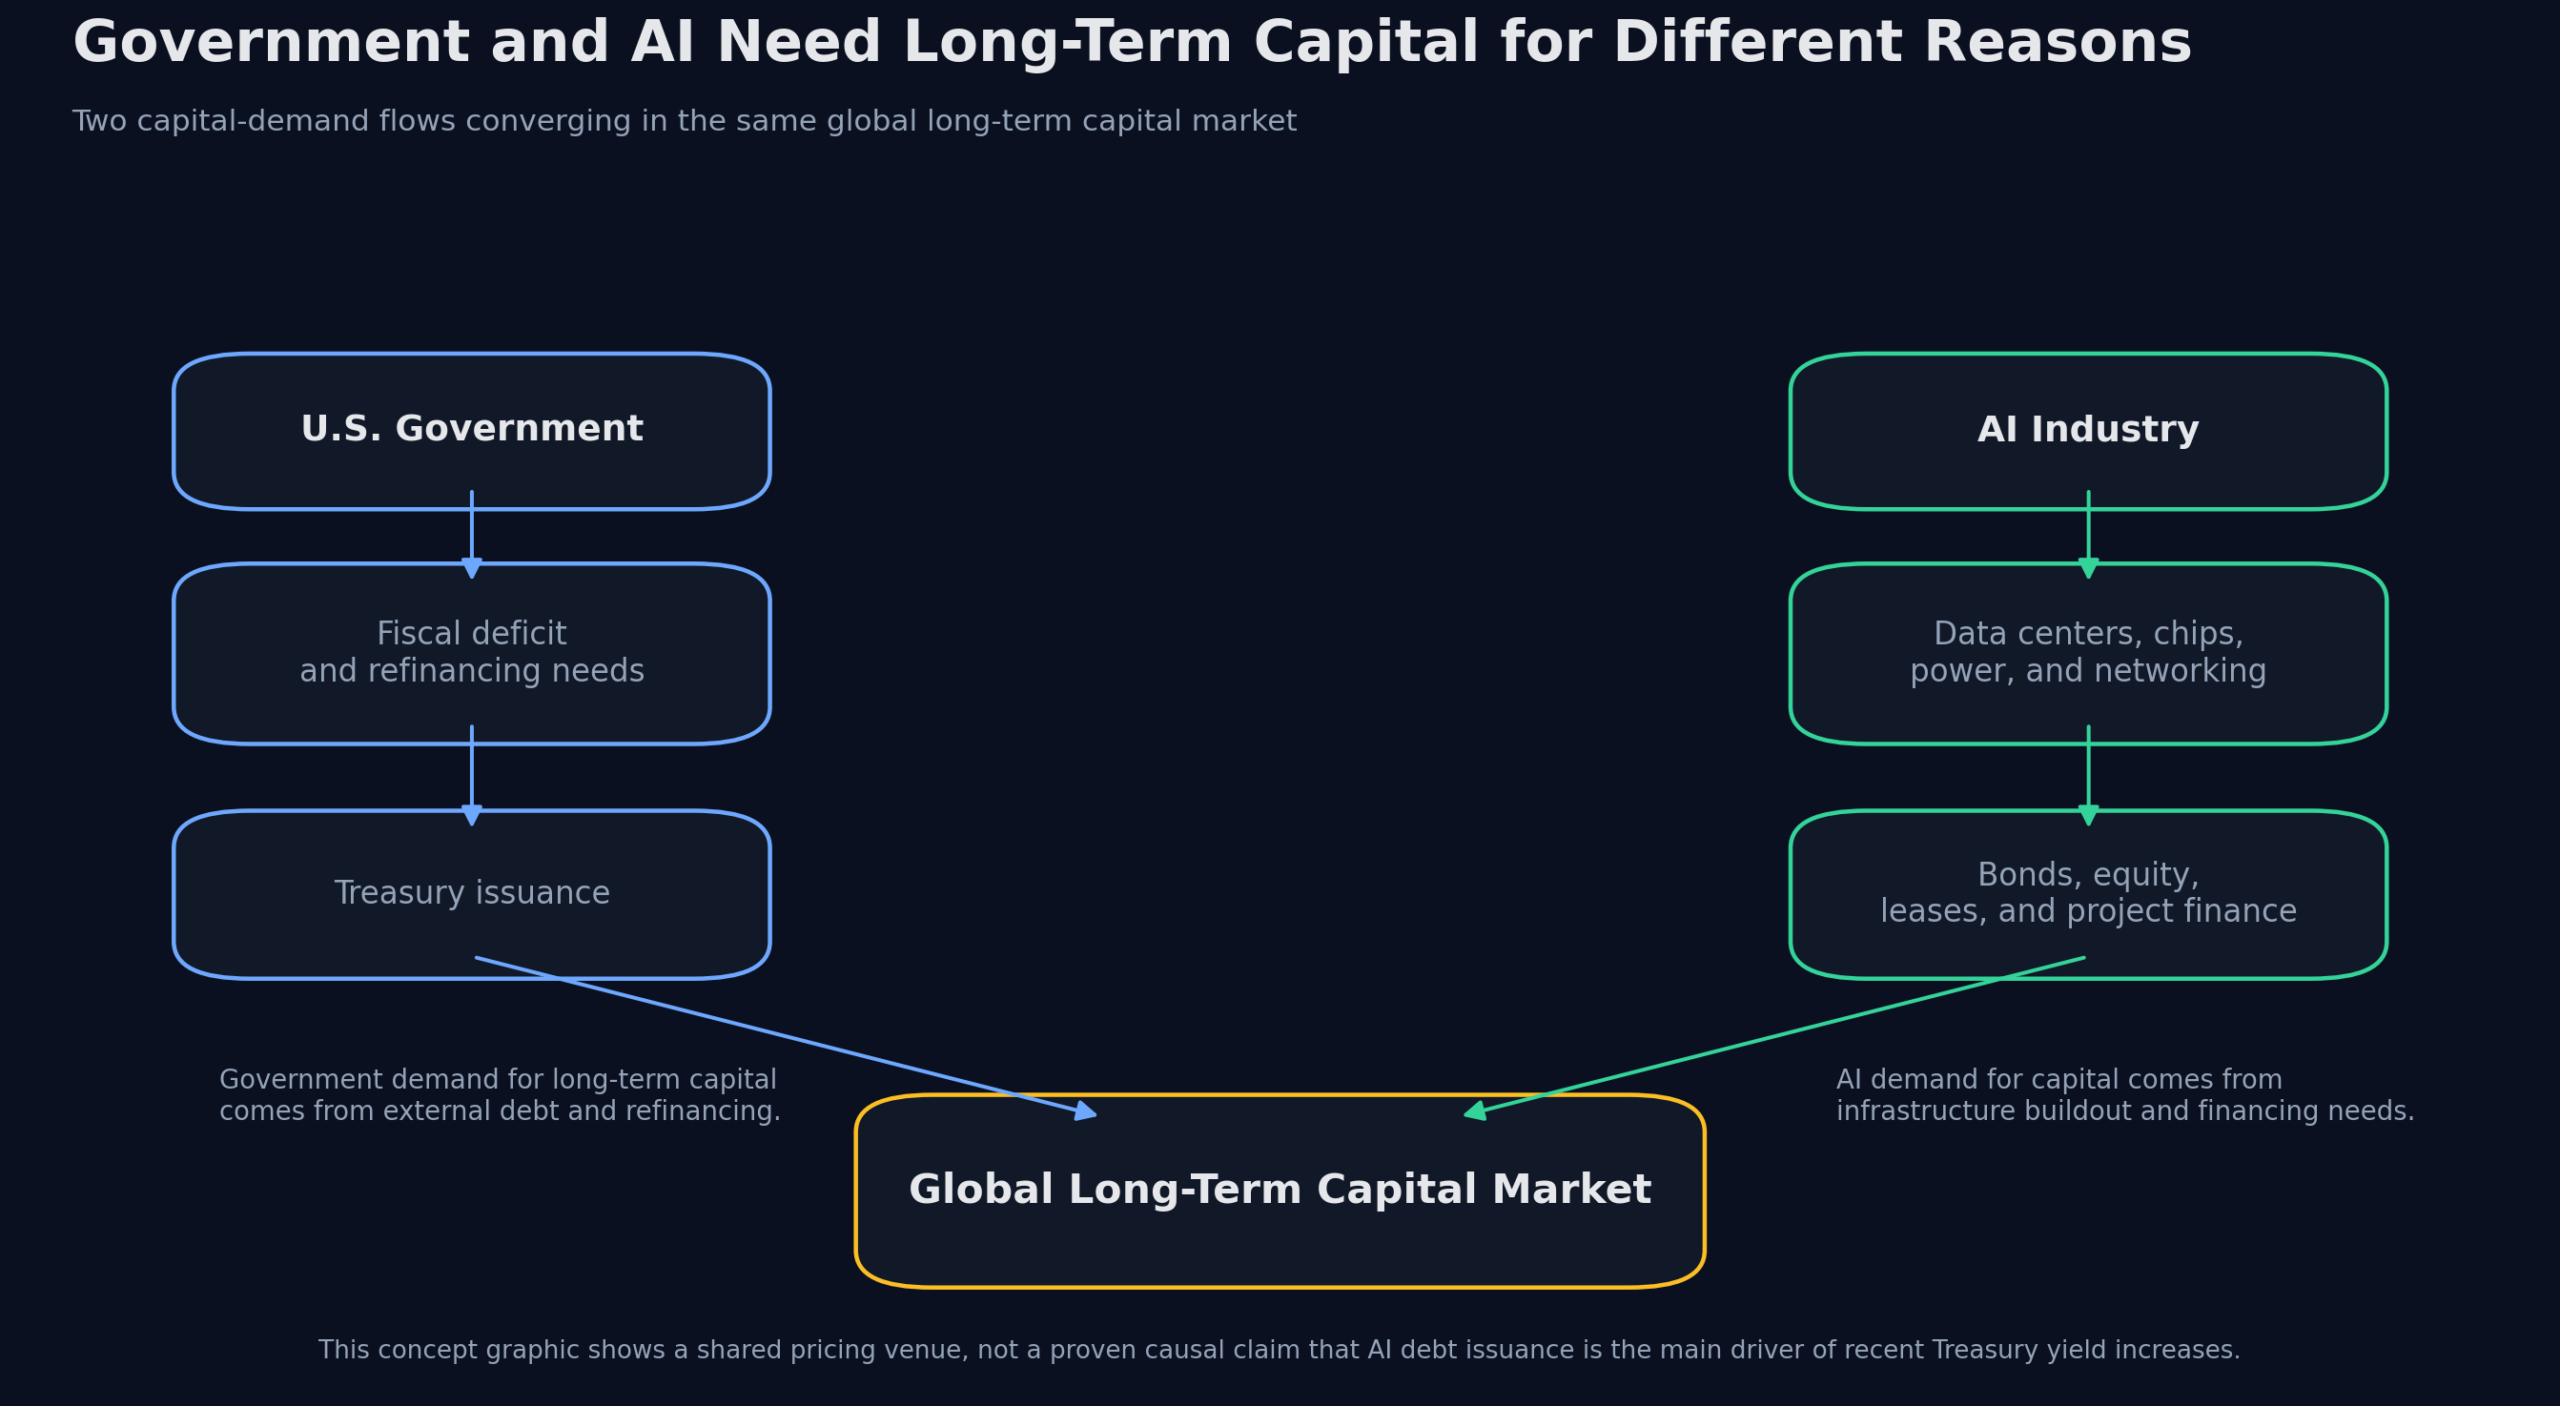
The AI industry is also currently attracting massive amounts of capital from the bond and stock markets.
If you only consider early generative AI, it feels like a software industry. However, GPUs are not the only things actually driving this industry today. Data centers must be built, power must be supplied, network equipment and cooling facilities are required, and semiconductor production capacity must be expanded. AI is increasingly becoming an industry that requires massive physical capital .
As investment in AI infrastructure grows, even Big Tech firms with massive cash flows are significantly increasing their external capital market financing, including corporate bonds. According to Reuters analysis, the four major players—Amazon, Alphabet, Meta, and Oracle—issued approximately $194 billion in corporate bonds through early July 2026. This represents a 79% increase from the annual total of about $108 billion in 2025. Goldman Sachs projects that the combined issuance of these five companies—including Microsoft—will reach $250 billion in 2026 and $400 billion in 2027.
The extent to which financing costs have risen is more clearly visible in the spreads. According to Reuters, bond issuance by AI hyperscalers totaled approximately $220 billion through August 10, and tech bond spreads widened to 89 basis points , 9 basis points wider than the overall investment-grade market. This is the opposite of the past, when tech bonds traded tighter than the market average. Amazon's $25 billion issuance was priced at about 120 basis points relative to Treasury bonds, which is double the spread of the previous year.
In the same week, Alphabet also raised A$5.5 billion, or approximately US$3.9 billion , through its first Australian dollar bonds. The maturities ranged from 3 to 20 years, with a 20-year coupon of 6.9% . However, this is an Australian dollar-denominated rate. Since dollar conversion costs vary depending on the AUD rate curve, currency hedging, and swap structure, this should not be directly compared to Alphabet's dollar-denominated borrowing costs.
It is not just bonds. On August 23, Alibaba announced that it would raise funds for AI chip, infrastructure, and model development through the issuance of new shares worth approximately $10.2 billion in Hong Kong. The stock price fell sharply the day after the announcement.
It is not that AI investment is decreasing. As competition intensifies, the required capital continues to increase. Structurally speaking, the U.S. government and AI companies ultimately raise long-term funds in the same global capital market. However, this explains the structure of capital flows; it is not a calculation showing how much the two have pushed each other's interest rates up.
However, we must not go a step further here. Based solely on the data used in this article, it is impossible to separately identify the effect of the current supply of AI corporate bonds on Treasury rates. Companies also mix operating cash flow, corporate bonds, stocks, leases, and project financing. In the case of Alibaba alone, it was a large-scale capital increase, not a bond.
5AI Stocks Now Hit Interest Rates Twice
For AI companies, long-term interest rates now enter through two channels: valuation and financing costs.
In the past, when discussing growth stocks, interest rates were primarily a matter of discount rates . For companies expected to generate large profits in the distant future, high interest rates reduce the present value of their cash flows. This is why tech stocks, which commanded high multiples, were the first to be pressured when long-term interest rates rose.
However, there is now one more factor added to the AI industry: financing costs . For companies investing tens of billions of dollars in data centers and AI infrastructure, the cost of capital becomes a variable of the business itself, rather than a valuation variable. In an environment where tech bond spreads have widened by 9 basis points compared to the investment-grade market, the break-even point differs even for the same project.
Of course, this burden does not apply equally to all AI companies. Companies that rely more on debt, leases, and project financing than those that invest using their own cash flow become more sensitive to the second channel. This is why the interest rate sensitivity of hyperscalers, data center developers, power utilities, and semiconductor companies differs significantly, even among AI-related stocks.
| channel | How it works |
|---|---|
| ① Discount Rate Path | Rising long-term interest rates → rising discount rates → falling present value of future earnings. Even if earnings estimates remain unchanged, the fair stock price decreases. The further away the timeline for earnings, the greater the impact. |
| ② Procurement Cost Channels | Rising long-term interest rates → Rising corporate bond and project financing rates → Increased actual costs of AI infrastructure investment. Even if the same amount of capital expenditure (CAPEX) is executed, the remaining profit decreases. |
※ The above classification is intended to explain the pathways through which interest rates impact AI company earnings and stock prices, and does not constitute an investment recommendation for any specific stock.
So, it seems that simply looking at whether “AI demand continues to grow” is no longer sufficient.
Industry growth and stock prices rising are two different stories.
The growth of the AI industry and the returns of AI stocks are not the same question. There is a step called price in between.
Looking at recent news alone, the industry itself remains strong. Google is expanding its collaboration with Marvell on custom AI chips, hyperscalers continue to invest in data centers, and Alibaba is also looking to expand its AI investments by raising over $10 billion in new funds.
Observing this trend, it is easy to conclude, "Since AI investment continues, AI stocks will continue to perform well." However, no matter how rapidly corporate profits grow, how much the market is willing to pay for those profits is a separate issue. And one of the key variables determining that price is the discount rate.
Therefore, I believe it is correct to view the two questions separately. Is the AI industry continuing to grow? And are current stock prices appropriate in relation to that growth? Answering "yes" to the first does not automatically lead to the answer to the second.
7So What Will We See Next?
It seems we need to add at least two more things to the list of observations we used to keep, which only included the CPI and the Fed.
The existing path was CPI → Fed → interest rate . Now, it is more in line with actual data to separate the path from CPI → Fed → expectations of future short-term interest rates and fiscal, government bond supply, inflation uncertainty, and geopolitics → Term Premium , and to consider that these two combine to form long-term interest rates.
We are looking at whether the CPI and PCE are returning to a stable trajectory. We are also considering that oil prices and geopolitical variables are once again becoming relevant.
How the market expects future benchmark interest rates. This corresponds to the “future short-term interest rate expectations” side in the ACM decomposition.
These interest rates move independently even if the Fed does not act. In particular, look at how the 30-year yield trades in the 5% range.
The NY Fed uses ACM data to distinguish whether gains stem from Fed expectations or risk rewards. It also examines Treasury issuance plans and demand for long-term bond auctions.
The New York Fed releases ACM-based Treasury term premium estimates as an official dataset. By keeping only the three series—
ACMY10 (10-year yield), ACMRNY10 (future short-term interest rate expectations), ACMTP10 (Term Premium)—one can directly analyze where the increase in long-term interest rates comes from whenever they rise. Charts 1 and 2 in this article were also drawn using that raw data. These three numbers provide the answer much faster than news headlines.8Frequently Asked Questions
| question | answer |
|---|---|
| What exactly is Term Premium? | It is the additional compensation investors demand in exchange for assuming the interest rate risk of long-term bonds instead of continuously rolling over short-term bonds. Inflation uncertainty, government bond supply, interest rate volatility, and geopolitical risk are all reflected at once. It is not a directly observed value, but rather a value estimated by the NY Fed using models such as the ACM. |
| If the Fed lowers interest rates, don't long-term rates also go down? | That is not necessarily the case. The 10-year yield is the sum of future short-term interest rate expectations and the term premium, but a Fed rate cut only lowers the former. In fact, between June 30 and August 20, 2026, the 10-year yield rose by 27.9 basis points even though Fed expectations fell by 2.5 basis points. |
| Then, should I reduce my AI stock holdings now? | This article does not make such a judgment on your behalf. However, it seems necessary to consider, when analyzing a portfolio, that believing in the long-term growth potential of the AI industry is different from viewing current stock prices as undervalued, and that companies highly dependent on debt and leases are more sensitive to rising long-term interest rates. |
Conclusion — Interest rates are not just one
Observing the stabilization of prices, one might assume that a favorable environment for AI stocks is being re-established. I do not believe that assessment is entirely wrong. AI investment continues to grow, and corporate infrastructure spending is at a historically unprecedented scale.
However, the recent bond market is telling a different story as well. The observed fact is this: the compensation investors demand for long-term lending has actually increased. Several candidates are cited as the cause: the U.S. government's continued financing, the capital demand of AI companies, and persistent inflation and geopolitical uncertainty. It is difficult to determine exactly how much each factor contributed based solely on the data in this article.
If that keeps long-term interest rates at high levels, AI companies face the simultaneous burden of discount rates and financing costs.
Honestly, I am not sure how long this trend will last. The Treasury's expanded buybacks could eventually pay off, and term premiums could be suppressed again as inflation is firmly brought under control. However, the question I am focusing on most right now is not just , "When will the Fed lower interest rates?"
It would be better to ask this instead: Even if the Fed lowers interest rates, will the U.S. 10-year Treasury yield fall along with it? Recent data suggests that, at the very least, the two do not necessarily move together.
Believing in the long-term growth potential of AI is a completely different matter from judging that current AI stock prices are cheap. And there is one variable between the two that we are prone to overlooking: long-term interest rates.
📌 Was this analysis helpful?
We will continue to monitor changes in long-term interest rates behind the Fed and AI capital costs. If you receive notifications, you won't miss anything.
How this content was produced
Aleph's research AI agent assisted with collecting and analyzing public data, creating charts and visuals, and structuring the draft. Davar personally reviewed and edited the sources, figures, reasoning, and final conclusions.
This content is for informational purposes only and is not personalized investment advice or an individual stock recommendation. Read the full disclaimer

Davar
Davar builds and operates Aleph's research AI agent and writes and reviews analysis on macroeconomic developments and AI industry trends.
© Aleph. All rights reserved.