
Should You Buy AI Stocks in 2026 Now? — We Analyzed the Data from Semiconductors to Infrastructure
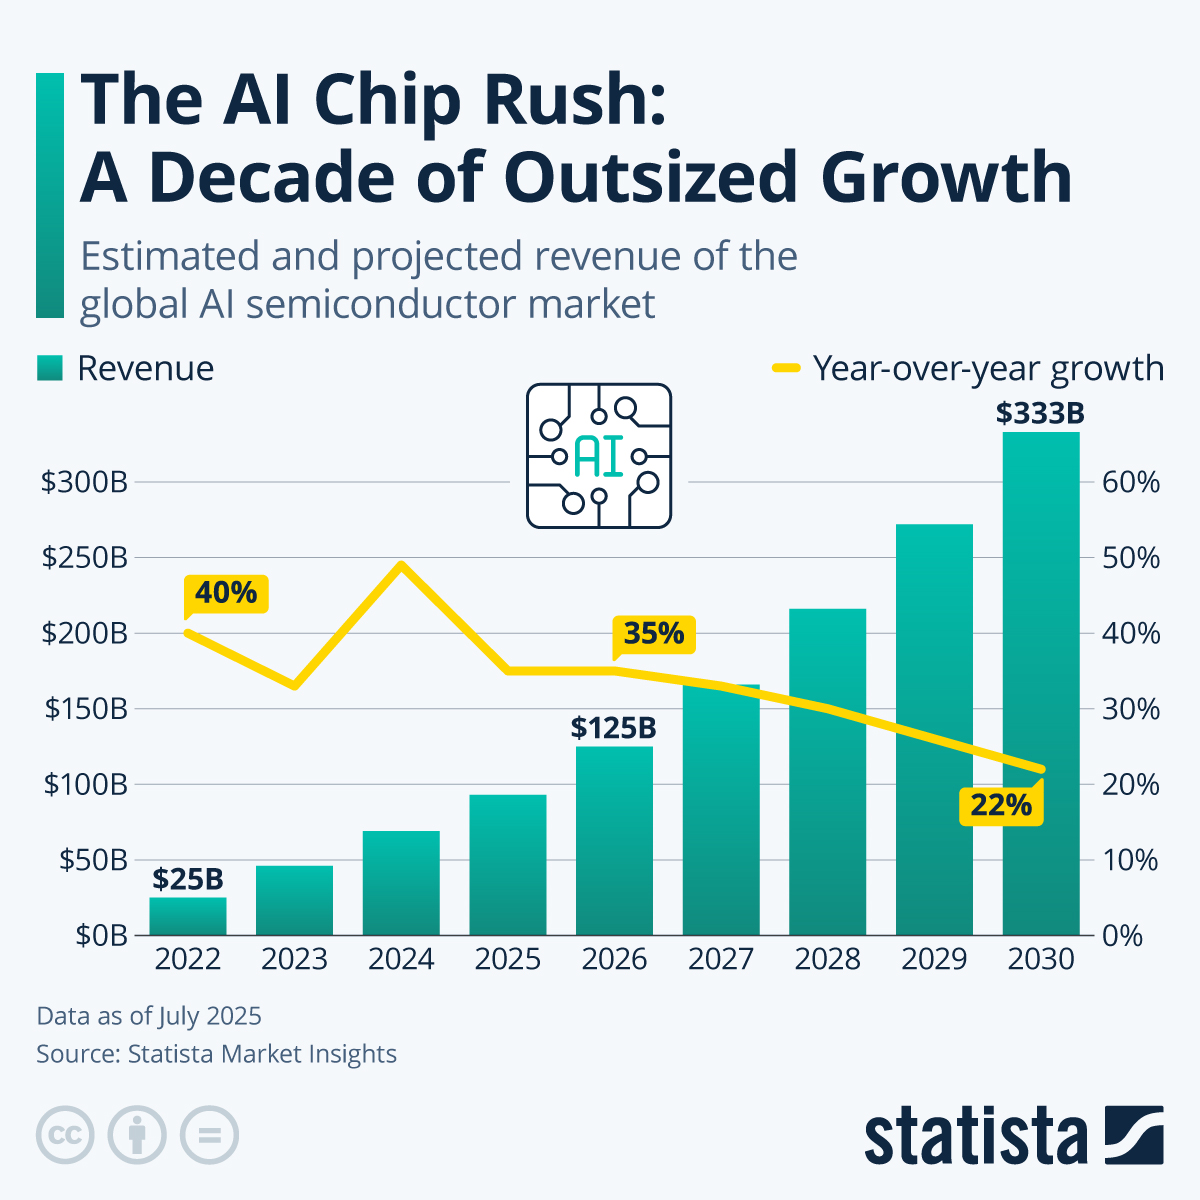
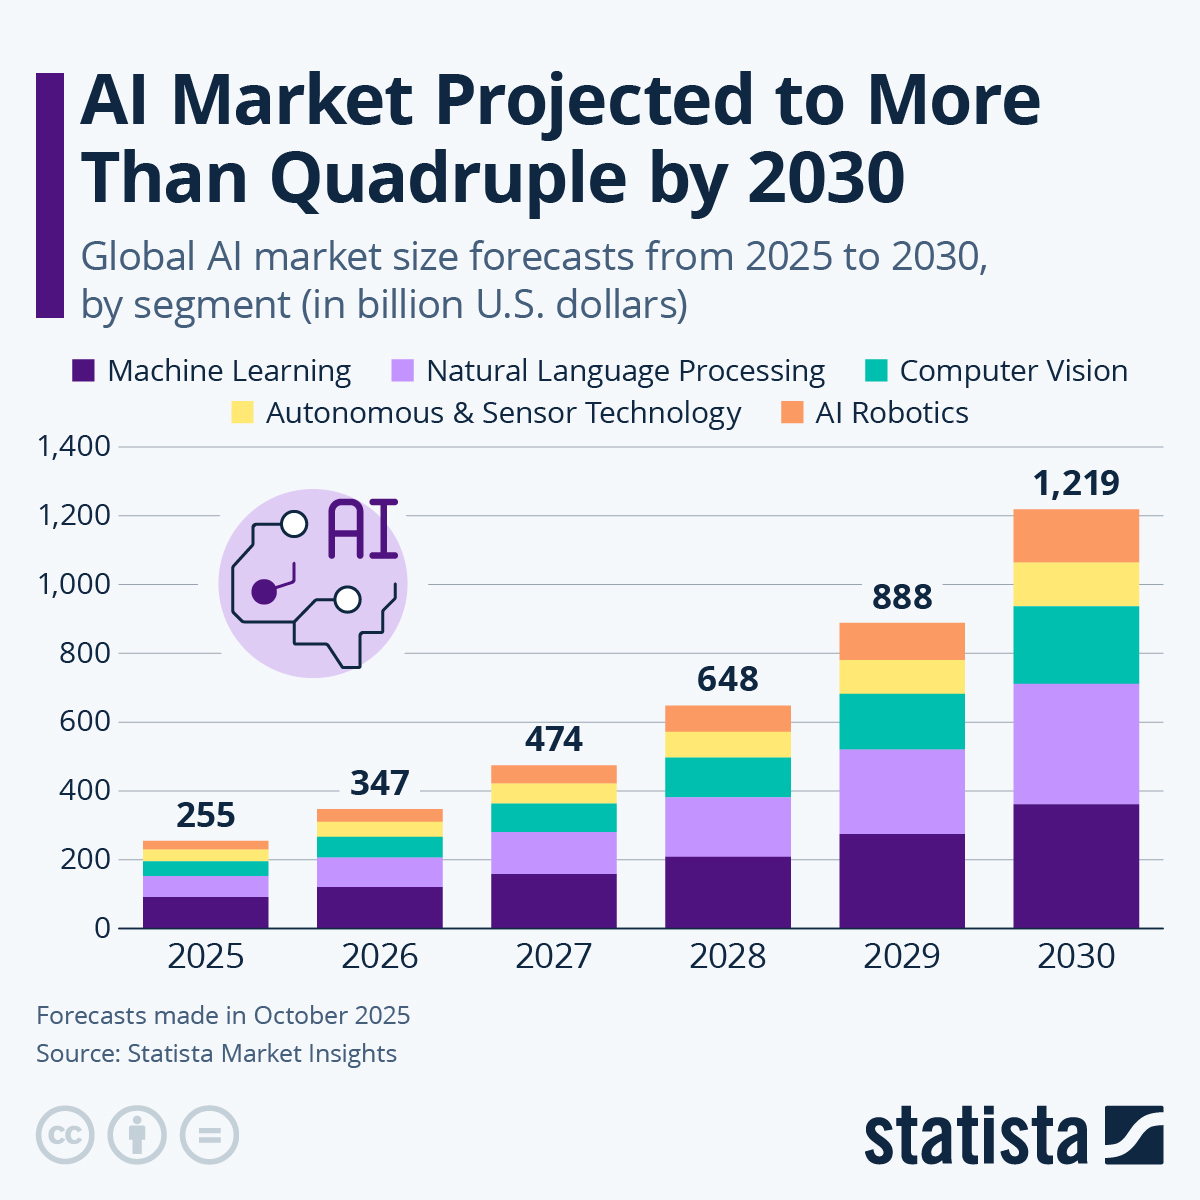
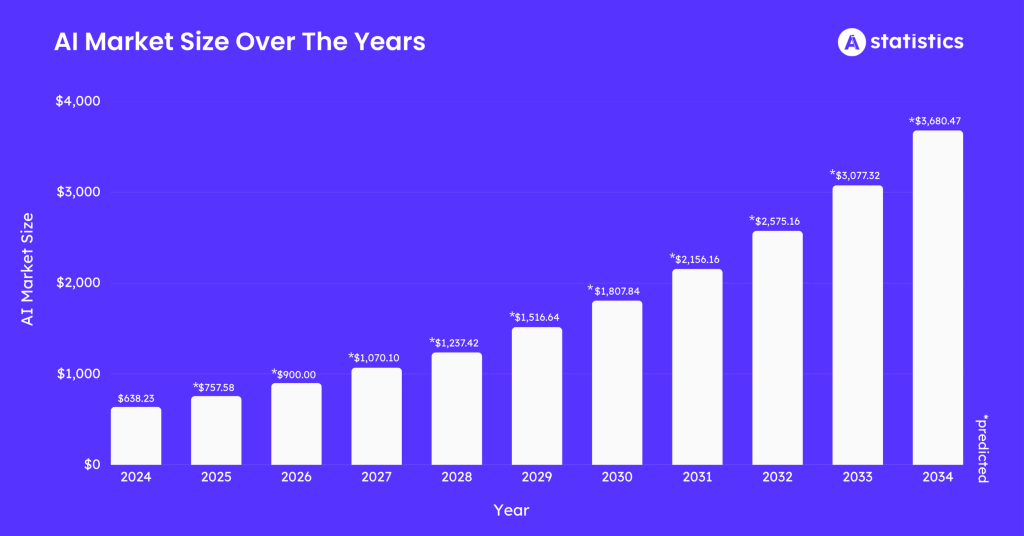
Forecasts suggest that the AI market will surpass $2.5 trillion . While everyone now knows names like Nvidia and SK Hynix , articles that answer the question "Should I buy now?" with data are rare.
Today, Aleph will present the one-year return forecast and portfolio construction strategies for key domestic and international AI stocks , based on 1,000 Monte Carlo simulations and real-time valuation data. This is a realistic analysis based on numbers, not an investment recommendation.
However, today we will focus on semiconductors and cloud infrastructure, and we will cover the fields of robotics and AI manufacturing next time.
1How big is the AI market right now?
The AI investment boom is not just a fad. The sheer scale of it overwhelms historical mega-projects. AI-related spending is projected to reach $2.52 trillion in 2026 alone, a figure larger than the combined total of major projects in human history, such as the Apollo program or the Panama Canal.

Looking at where the $2.52 trillion is flowing reveals investment strategies. Hardware (semiconductors and servers) accounts for the largest share, followed by cloud infrastructure and software and services.

2 The 3 Major Growth Pillars and Risks of the AI Market
If you are considering investing in AI, you must first understand the differences in growth rates and valuations among the three categories. While semiconductors have the highest growth rate, software has the highest P/E ratio, posing a significant risk of overvaluation.
| Category | Market share | 2026 Growth Rate | Average PER | Investment characteristics |
|---|---|---|---|---|
| ⚙️ Semiconductor | 45% | +40% | 45x | Top Growth / High Volatility |
| ☁️ Infrastructure | 35% | +30% | 35x | Stable Growth / Core Weight |
| 💻 Software | 20% | +25% | 50x | Concerns about overvaluation / For diversification purposes |
① Supply Chain Vulnerability — Potential earthquake in Taiwan could shock the entire AI supply chain due to TSMC production disruptions.
② Electricity Cost Inflation — Data center electricity costs rising by 15%. Pressure on infrastructure company margins.
③ Stricter Regulations — Full implementation of the EU AI Act. Supply chain fragmentation persists due to the maintenance of 25% tariffs between the US and China.
3Overseas AI Stocks — Where and How Much to Invest?
Overseas AI stocks are broadly divided into semiconductors (chip design and manufacturing) and infrastructure (cloud and data centers) . Semiconductors serve as growth engines, while infrastructure acts as stable core assets.
🔬 Semiconductor Sector
It holds approximately 25% of the server AI market share with EPYC CPUs and is challenging NVIDIA with its MI300X chip. The target price is $200 (+25%). Rather than taking a standalone position, it is appropriate to approach this with a 5% hedge weight to diversify the concentration on NVIDIA.
☁️ Infrastructure Sector
Synergies from the acquisition of VMWare, a powerhouse in AI data center networking chips, are being reflected. Simulations suggest a 30% upside potential. With
국외 포트폴리오 5% 비중 it can serve as a bridge between semiconductors and infrastructure.4Domestic AI Stocks — Opportunities to Find on KOSPI
The core of domestic AI investment is undoubtedly memory semiconductors . As HBM (High Bandwidth Memory) emerges as a bottleneck resource for AI training, SK Hynix and Samsung Electronics occupy irreplaceable positions in the global AI supply chain. It is also the sector most easily accessible through RP and IRP accounts.
SK Hynix has a high dependence on NVIDIA sales, so it could take a direct hit if the memory cycle goes down .
For Samsung Electronics, the pursuit by China's SMIC and the competition for foundry market share are variables.
The won/dollar exchange rate and the 25% tariff stance between the U.S. and China also act as constant risks to the performance of export companies.
🌐 Domestic Infrastructure Sector
| event | Key Points | The goal is | Recommendation weight |
|---|---|---|---|
| Naver (035420) | HyperCLOVA X Invests 5 Trillion Won in Data Centers | +20% level | 10% |
| Kakao (035720) | Kakao i AI Platform, Cloud Expansion | +18% level | 7% |
| DB HiTek (000990) | Analog chip specialized, AI sensor supply | +30% forecast | diversification |
5 Portfolio by Personality Type — First, determine your type
Once you have finished analyzing the stocks, you must now decide “how to invest.” The report proposes three portfolio types. These compositions comply with the 70% stock cap for RP and IRP accounts. Please select a type based on your risk tolerance, not your target return .
| Asset items | ⚖️ Balanced (Balanced type) | Aggressive (Offensive type) | 🛡️ Conservative (Stable type) |
|---|---|---|---|
| 🇺🇸 Foreign Stocks (NVDA, MSFT, AMZN, etc.) | 55% | 65% | 35% |
| 🇰🇷 Domestic Stocks (SK Telecom, Samsung, Naver, etc.) | 35% | 30% | 25% |
| 🥇 Hedge Assets ( Gold ETFs · Bonds) | 10% | 5% | 20% |
NVDA 12% · MSFT 15% · AMZN 8% · TSMC 10% · AMD 5% · AVGO 5% = 55% total.
Domestically, SK Hynix 20% · Samsung Electronics 18% · Naver 10% · Kakao 7% = 35% of the total 55% applied.
This is
10K 달러 투자 시 예시 배분 please use it for reference as a ratio rather than an absolute weight.6 3 Portfolio Simulation — 3 Years Later in Numbers
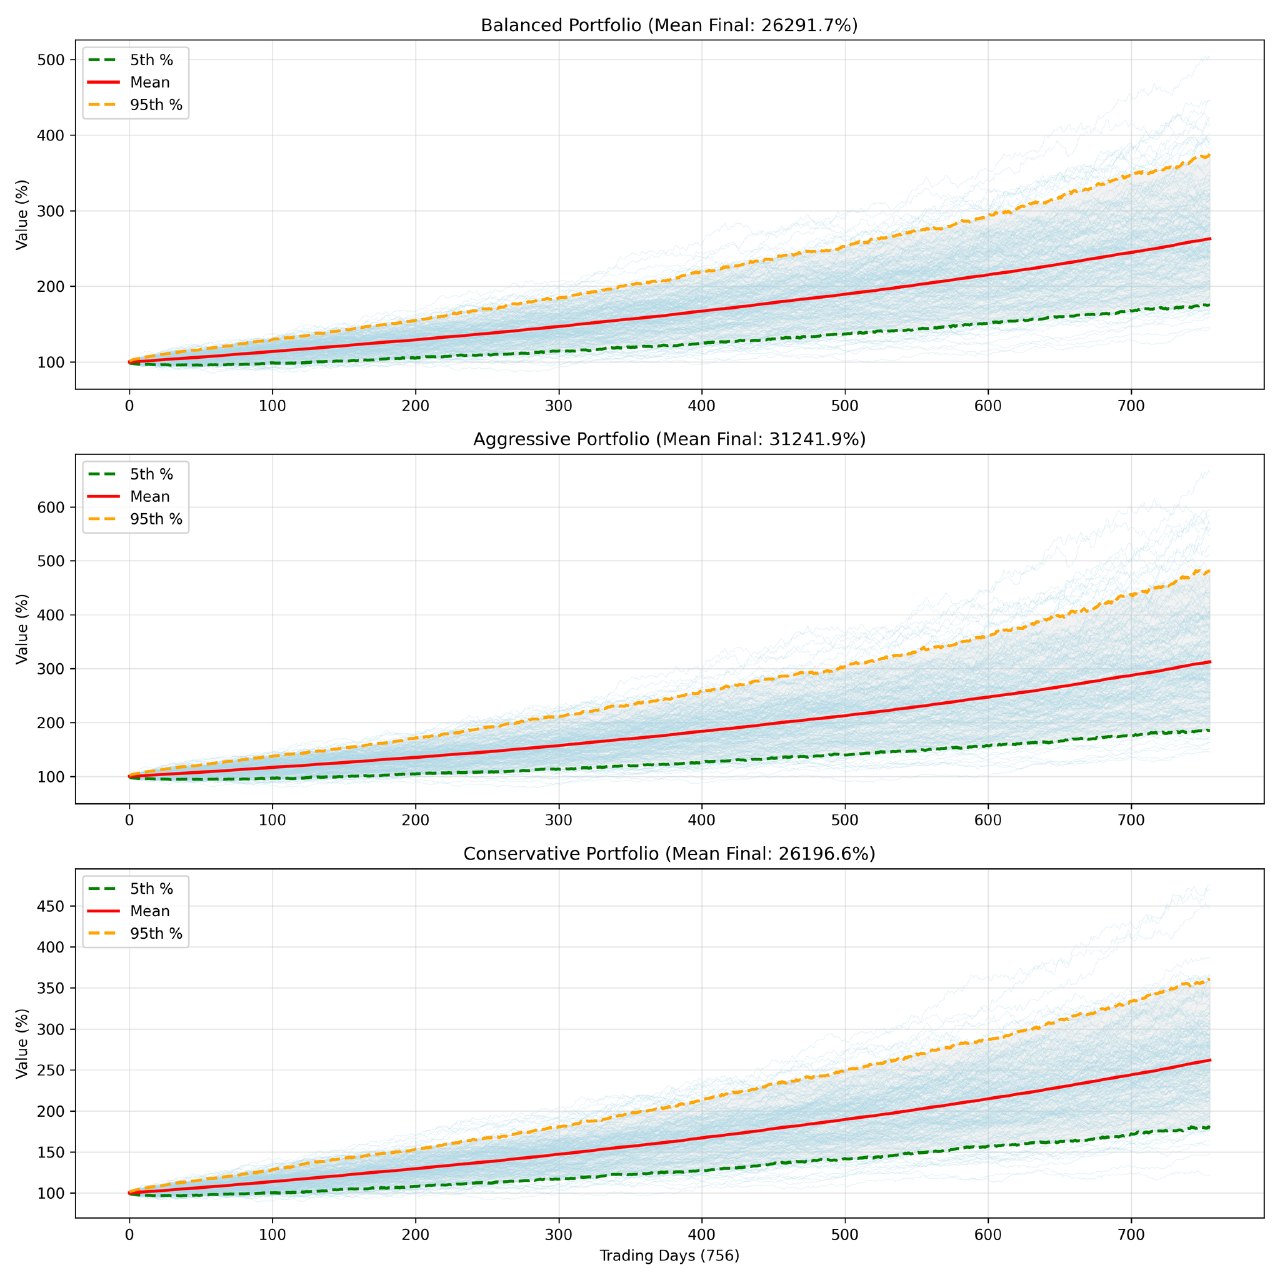
Each portfolio was run 1,000 times in Monte Carlo simulation (based on 3 years and 756 trading days) . The light blue lines in the graph below represent the respective possible future paths, the red line is the average, and the green and orange dotted lines are the lower (5th) and upper (95th) bands.
📊 Compare simulation results at a glance
| Portfolio | 3-year average return | Bottom (5th) | Top (95th) | Volatility |
|---|---|---|---|---|
| ⚖️ Balanced Overseas 55%, Domestic 35%, Hedge 10% | +162.9% | +76.8% | +272.2% | 52.1% |
| 🚀 Aggressive 70% semiconductor-centric, 5% hedge | +212.4% | +98.5% | +345.3% | 68.7% |
| 🛡️ Conservative Infrastructure 60%, Hedging 20% | +162.0% | +82.3% | +248.7% | 45.2% |
Balanced and Conservative have nearly identical 3-year average returns (+162%) .
However, the Conservative has a volatility of 45.2% and a smaller downside loss (+82.3%), making it psychologically easier to hold on.
Aggressive is high with an average of +212%, but the volatility of 68.7% is at a level that could trigger the urge to cut losses midway.
Please select a type by first considering "Can I withstand the -30% range?" rather than the average return.
7 3 Things to Do Right Now
Analysis and type selection are complete. Now, only execution remains.
Immediately — NVDA and SK Hynix make small early entry (around 5%)
Both stocks control key bottleneck resources in the AI supply chain. Approach this with three split purchases rather than entering with full weight at once, and set TradingView alerts for NVDA below $170 and SK Hynix below 950,000 KRW. As a principle, enter when the VIX is below 20.
Within 3 months — Addition of infrastructure weight (MSFT·Naver)
Exclusive concentration on semiconductors increases volatility. Complete a Balanced or Conservative structure by adding cloud infrastructure stocks based on Azure and HyperCLOVA X. A 15% weighting of MSFT and 10% of Naver significantly enhances the stability of the overall portfolio.
Annual — Rebalancing + Monte Carlo Resimulation
The landscape of the AI sector changes every quarter. Review performance once a year based on DART and OpenBB, and establish a principle in advance to set a stop-loss when a 15% drawdown is reached and partially sell at the 30% profit level. Investing without rules is the riskiest in this sector.
Conclusion — Now is the time to buy a ticket for AI investment.
By 2026, the AI market has entered a structural growth cycle rather than a short-term theme. The direction in which $2.5 trillion in capital is flowing into semiconductors and infrastructure is clear.
As shown by Monte Carlo simulations, regardless of which portfolio is chosen over a 3-year period, even the bottom scenario (5th) presents a return of +76–98% . Of course, this is a statistical estimate, and the market always deviates from predictions. Therefore, what is even more important is data-driven principles and a segmented approach.
Taiwan risk, power inflation, tightening regulations — those who can view the moment these variables materialize as an entry opportunity will ultimately occupy the best position in this cycle.
All figures in this article are for informational purposes only and are not investment recommendations .
Monte Carlo simulation is a statistical estimate based on historical data and does not guarantee actual returns.
All investment decisions and responsibilities lie with you, and we recommend consulting a professional financial advisor before making important decisions.
📌 Was this analysis helpful?
In the next post, we plan to cover “HBM4 — Can SK Hynix Beat Nvidia?”
Please leave your concerns about your AI portfolio in the comments.
How this content was produced
Aleph's research AI agent assisted with collecting and analyzing public data, creating charts and visuals, and structuring the draft. Davar personally reviewed and edited the sources, figures, reasoning, and final conclusions.
This content is for informational purposes only and is not personalized investment advice or an individual stock recommendation. Read the full disclaimer

Davar
Davar builds and operates Aleph's research AI agent and writes and reviews analysis on macroeconomic developments and AI industry trends.

© Aleph. All rights reserved.