
Why are AI stocks rising, yet the funding sources for AI are drying up? In the previous series, Aleph warned that “the epicenter of the AI financing bubble is not demand, but the financing structure.” That warning is now being confirmed by figures from FSB, Fitch, and Morgan Stanley. In the first quarter of 2026, the private credit market experienced a net outflow of funds for the first time in history. While the demand for AI is genuine, the structure of the funding sources supporting AI is shaking. The source is the software (SW) layer.
What is 1Private Credit? — The Hidden Funding Source for AI Startups
Private credit is a form of shadow finance that provides loans that banks do not offer. Companies with low credit ratings or small scales that find it difficult to access the public bond market—particularly AI startups, SaaS firms, and data center developers—raise funds in this market. According to the Financial Stability Board (FSB) May 2026 report, the global market size is approximately $1.5 to $2 trillion (about 2,000 to 2,700 trillion won) .
There is only one reason why this market is important right now: a significant portion of the AI infrastructure boom is being driven by this capital. By 2025, the share of AI-related deals in total private credit deals had risen to 34% . This figure has doubled from the average of 17% just five years ago (based on FSB reports, cited CAIA 2026.5). Behind the AI boom lay this quiet capital market, neither banks nor the stock market.
However, cracks are now forming in this market. And simultaneously, from three directions.
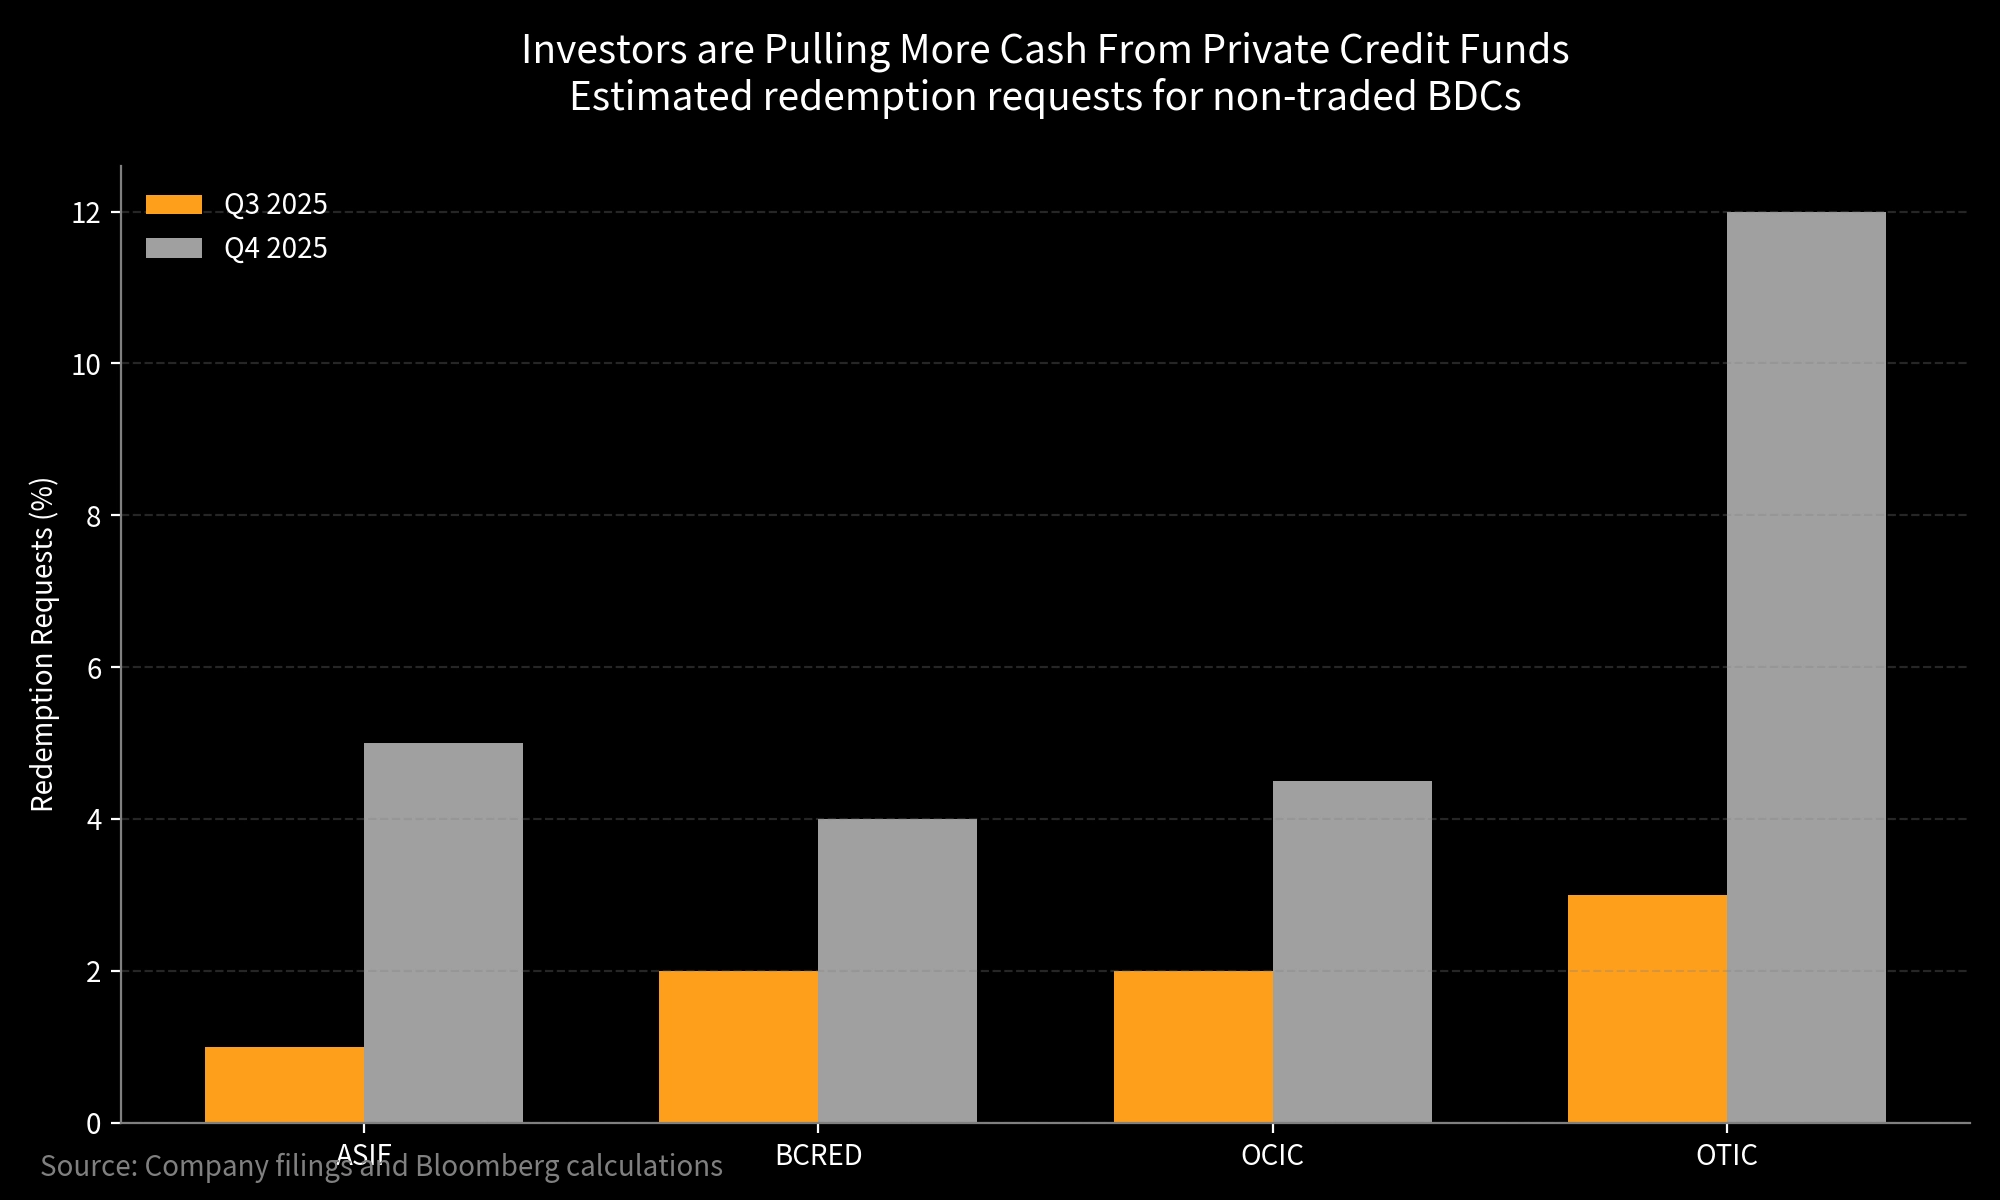
2What is Happening Now — 4 Numbers
Looking solely at the numbers, it reads like a crisis. However, there is an important context. In the same report, Morgan Stanley explicitly stated that it is “significant but not systemic.” While it is true that defaults are increasing, this is a different story from the 2008-style systemic collapse. This is exactly the same structure analyzed by Aleph in the ① Bubble Warning Post . Demand ( CapEx , token consumption) is real, but the financing layer is vulnerable—and that vulnerability is now manifesting in the figures. Therefore, we must examine where that crack originated.
3Why Software Is the Epicenter
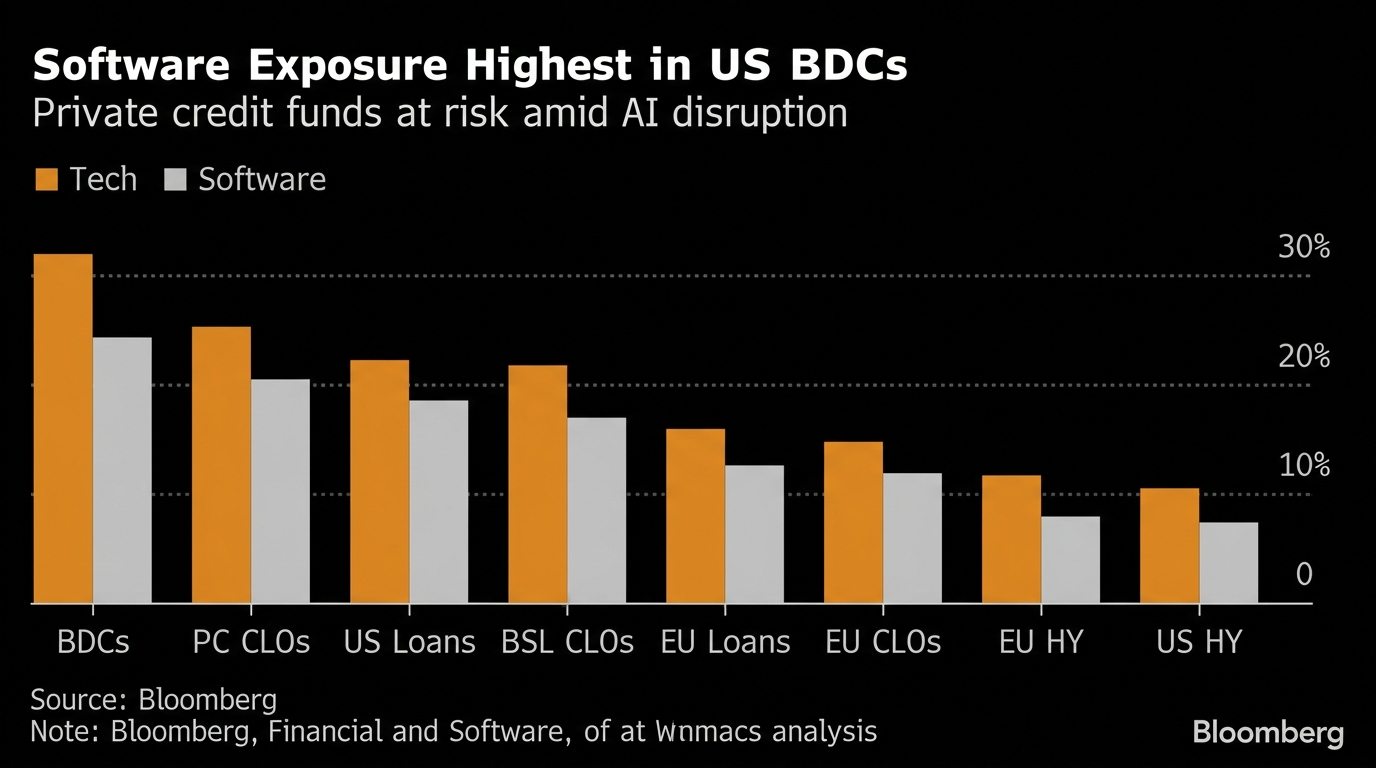
Approximately 26% of private credit direct loan portfolios are concentrated in software companies (based on Morgan Stanley, BDC holdings). This is the crux of the problem right now.
With the emergence of AI agents, fears that subscription-based SaaS software might become obsolete gripped the market. Software stocks fell by approximately 30% between October 2025 and February 2026, while BDC stock prices dropped by an average of 10% during the same period. However, the net asset value (NAV) of software loans held by BDCs has not yet decreased by that much. The market has already factored in the losses, yet the books are turning a blind eye.
Blackstone's flagship private debt fund, BCRED, recorded a monthly loss in February 2026 for the first time in three years. Golub Capital, with a software weighting of approximately 26%, cut its dividend by 15%, and Blue Owl liquidated $1.4 billion in loan assets in February. These are not isolated events; they are simultaneous signals pointing in the same direction.
| Funds / Institutions | Software exposure | Recent Trends | source |
|---|---|---|---|
| Blackstone BCRED | private | First Monthly Loss in 3 Years in February 2026 — Valuation Losses on SaaS Loans Including Medallia | CNBC, FT |
| Golub Capital | About 26% | 15% dividend cut, additional 10–20% cut expected | CAIA (2026.5) |
| Blue Owl | High (SaaS-centric) | Disposal of $1.4 billion in loan assets, stock price down 41% year-to-date | CNBC (March 2026) |
| Apollo | Reducing from approximately 20% to 10% | Preemptively halve software share starting 2025 | CAIA (2026.5) |
The Real Structural Risks Warning by 4FSB
The FSB's warning is not merely about a "rising default rate." It points to more fundamental structural problems.
Opacity — No one knows the real risks
Private credit is not a public market. Loan valuations are conducted once a quarter, and even then, involve significant discretion. The FSB report stated that “valuation practices may involve significant discretion.” The core problem is a structure where no one can be certain whether the books are genuine.
Leverage layered structure — losses are amplified
Private credit leverage is layered across multiple levels, extending from portfolio companies and funds to sponsors and investors. The typical debt-to-EBITDA ratio is 5 to 6 times, rising to 7 times when EBITDA adjustments are removed. This is why a loss in one layer shakes the entire structure.
The connection with the bank — deeper than you think
The FSB stated that while direct credit extensions by banks' private credit funds amount to approximately $220 billion (sum of drawn and undrawn), the figure could be more than double that based on commercial data. This is a link where the collapse of private credit could shake bank balance sheets as well.
Unverified durability — has never experienced a recession
The key sentence from the FSB report is here: “Private credit remains untested to a prolonged economic downturn.” The current private credit market was created during a time of abundant liquidity, before interest rates rose. It is an asset class that has never experienced a real recession.
5 Is It a Bubble? — Aleph’s Judgment
Let me start with a one-line conclusion. It is a partial bubble — centered on the Financing Layer.
| Layer | Current status | Aleph judgment |
|---|---|---|
| demand layer ( AI CapEx · Cloud Token Consumption) | Combined AI infrastructure investment by the top 4 tech companies to reach approximately $650 billion by 2026 — continuously expanding | ✅ Solid real demand. ① Identical to the structure analyzed in the bubble warning post. |
| SW Financing Layer (SaaS loan-focused BDC) | Rising Default Rates + Repayment Pressure + NAV Discrepancy Proceeding Simultaneously | ⚠️ Vulnerable. A phase where the revenue model itself is shaken by AI replacement risks. |
| Infrastructure Financing Layer (Data Center · Power · Cooling Loans) | Demand is strong, but there is opacity in the financing structure. | ⚠️ Neutral to Caution. Demand is real, but financing structure risks need to be reviewed. |
| physical infrastructure layer (Power · Cooling · Data Center REIT) | Low reliance on private credit and a solid foundation of real demand | ✅ Relative Safe Zone. ② The structure exactly as analyzed in the surviving layer post. |
This is not a situation where demand itself is a fiction, like the dot-com bubble (1999). The demand for AI is real. However, the overheating of the financing structure concentrated in the SW layer is now confirmed by the numbers. This structure aligns exactly with the judgment Aleph has maintained throughout the series—“Short-term corrections are coming, but pick the layers.” The SW risk / physical infrastructure safety structure analyzed in the ② Surviving Layers post has been reconfirmed by today's data.
6Frequently Asked Questions
| question | answer |
|---|---|
| Does the private credit crisis directly affect AI-listed stocks? | Direct connections are limited. Private credit is an unlisted lending market, and its structure differs from that of listed AI stocks. However, if SaaS companies struggle to raise funds, their growth slows, which is indirectly reflected in software-related AI ETFs. |
| How serious is a Fitch default rate of 5.8%? | This is more than double the historical average default rate of 2–2.5%. Based on PMR (Private Market Rating) portfolios, it has risen to 9.2% annually by 2025. However, since the actual recovery rate remains at the 70–90% level, default itself does not necessarily mean a total loss. |
| How are Korean investors exposed to this risk? | There are very few direct domestic BDC investors. However, you are indirectly exposed if you hold global AI ETFs with a high software weighting or Nasdaq- focused ETFs. It is necessary to review which layer to invest in. For domestically accessible AI infrastructure layer ETFs, please refer to ③ Domestic ETF Guide . |
| Will the crisis end if the net outflow of BDC stops? | While it is true that repayment pressure is easing, there is a separate key variable. As actual revenue data for SaaS companies begins to emerge in the second half of 2026, there will come a point where the gap between book value and market value of NAV is forcibly narrowed. That is the point where the real risk is identified. |
| Is investment in the AI infrastructure layer still valid? | It is valid. Power, cooling, and data center REITs have a structure separated from SW financing risks. However, if instability in the private credit market raises overall financing costs, the infrastructure layer will also face upward pressure on indirect costs. The analysis of the layers that will survive the bubble was covered in the post ② Layers That Will Survive . |
Conclusion — SW is risky, so where does the money go?
One thing confirmed in this article is that the precursors to the AI bubble have materialized not as vague "concerns about overheating," but through figures from the FSB, Fitch, and Morgan Stanley. And the epicenter is the software layer.
The judgment Aleph has maintained throughout this series—“Short-term corrections are coming, but growth drivers are sufficient; choose the right layer”—has been confirmed today by figures from three institutions. The direction presented in ③ Domestic ETF Guide and ④ AI Agent Growth Driver Post also remains valid. Now that the risks of the SW Financing layer have been confirmed by numbers, those funds will eventually move somewhere. There is only one question: Where will the funds exiting the crisis flow? We will track that flow in the next post.
All figures in this article are for informational purposes only and do not constitute investment advice. The Fitch PCDR 5.8% figure is based on TTM as of January 2026, while Morgan Stanley's 8% forecast is based on a scenario from the second half of 2026 to the first half of 2027. The $2 billion net BDC outflow is a Bloomberg and iCapital estimate (Q1 2026), and the 34% figure is cited by CAIA based on an FSB report. All investment decisions and responsibilities rest with the individual, and consulting with a professional financial advisor before making any significant decisions is recommended.
📌 Was this analysis helpful?
Aleph continues its AI investment bubble series. Now that SW layer risks have been confirmed by numbers, we will track post-crisis fund flows in the next post.
👉 Read also in this series: ① AI Bubble Warning · ② The Layers That Will Survive · ③ Domestic ETF Guide · ④ AI Agent Growth Drivers
How this content was produced
Aleph's research AI agent assisted with collecting and analyzing public data, creating charts and visuals, and structuring the draft. Davar personally reviewed and edited the sources, figures, reasoning, and final conclusions.
This content is for informational purposes only and is not personalized investment advice or an individual stock recommendation. Read the full disclaimer

Davar
Davar builds and operates Aleph's research AI agent and writes and reviews analysis on macroeconomic developments and AI industry trends.

© Aleph. All rights reserved.