
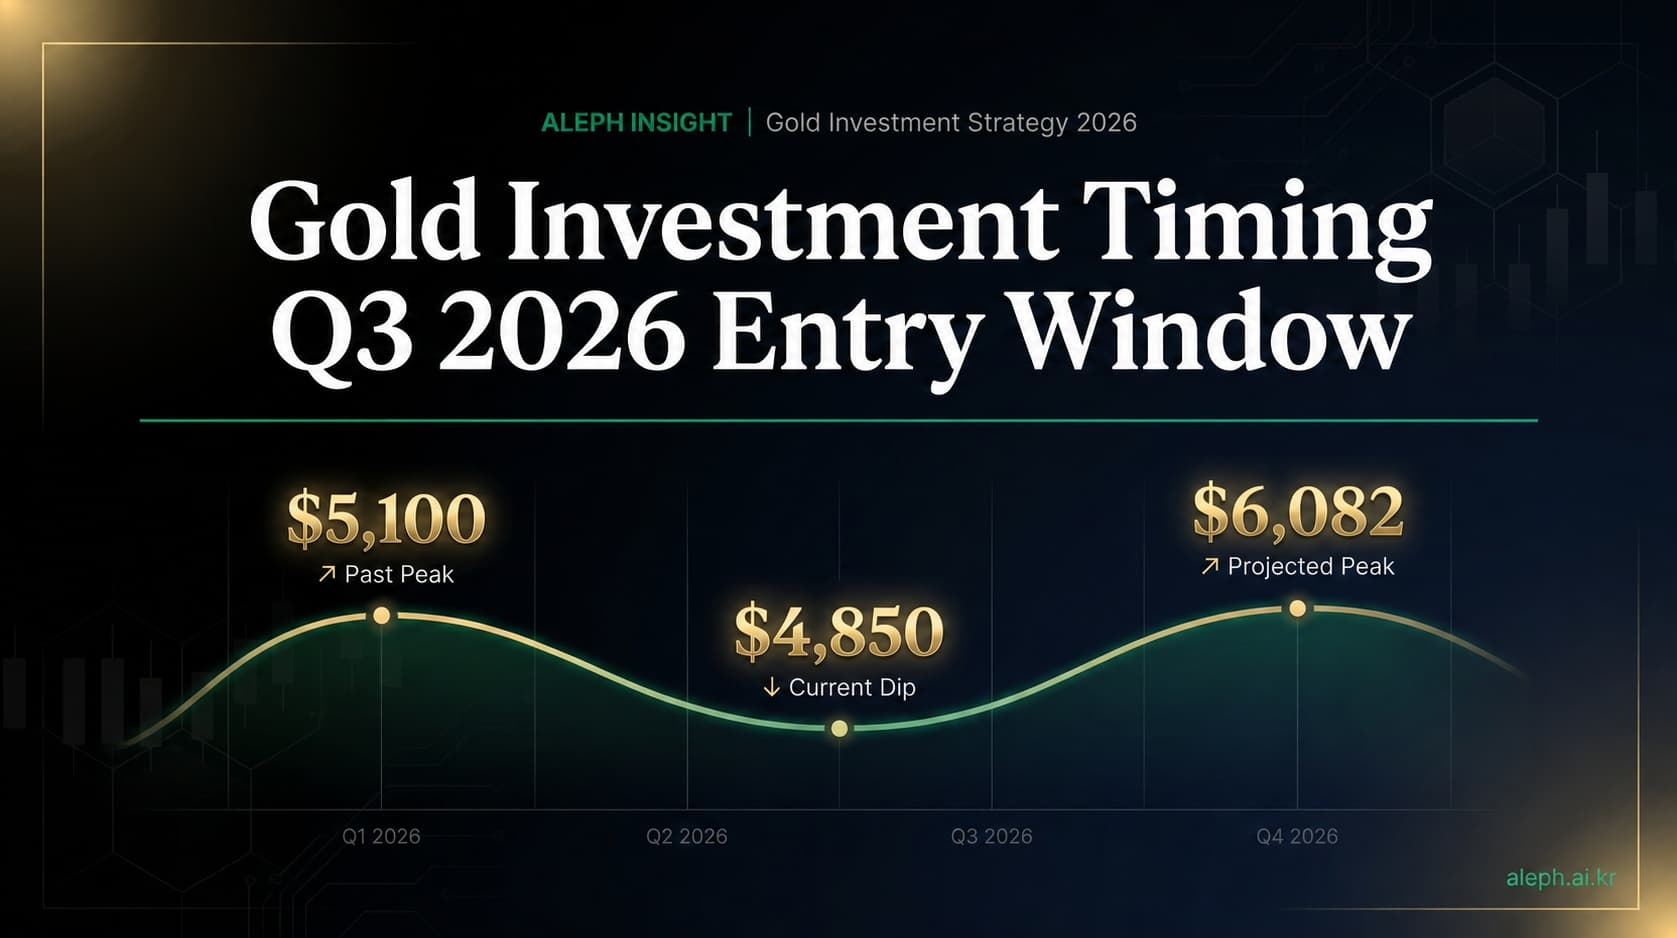
Let me start with the conclusion. The direction is correct, but not right now. Today, the US April CPI was released at 3.81%. While this significantly exceeded expectations (3.3%), gold did not rise; instead, it fell. This is the exact opposite of textbook theory. However, this paradox actually makes the logic for a mid-term rally even clearer. Although the analysis model by professional investment agent Aleph has lowered its short-term NO_GO rating, the mid-term target price of $6,082 remains intact. The likely trigger for the turnaround is the third quarter of 2026 (July–September) . I will explain, step-by-step, why the short and mid-terms move in opposite directions and how you should position yourself right now.
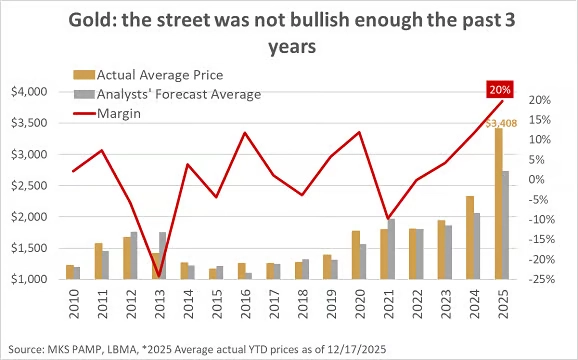
1Where has the price of gold gone since March?
Although it has rebounded by more than $300 from the March low ($4,377), it has not yet recovered the all-time high ($5,100) reached in January. In a post last March, I analyzed the paradox where the price of gold actually fell despite the outbreak of war. The same pattern has emerged again following today's CPI release. Let's examine the data first.
| Point of view | Gold spot price | Major Events |
|---|---|---|
| 2025-01 | $2,637 | benchmark |
| 2026-01-26 | $5,100 | All-time high |
| 2026-03-23 | $4,377 | Low point since the US-Iran war |
| 2026-04-15 | $4,831 | rebound |
| 2026-04-30 | $4,609 | adjustment |
| 2026-05-12 | $4,688~4,706 | April CPI release day (current) |
2Today's CPI 3.81% — What the Numbers Tell Us
The oil price shock triggered by the war is still spilling over into consumer prices. The Consumer Price Index for April, released today (May 12, 2026) by the U.S. Bureau of Labor Statistics (BLS), rose 3.81% year-on-year. This figure exceeded the market forecast of 3.3% by 0.5 percentage points. With the energy sector alone rising by 3.81% in just one month, it signifies that the aftermath of the U.S.-Iran war is still ongoing.
Immediately after the announcement, the Dollar Index (DXY) turned bullish, rising from 97.94 to 98.38, and the U.S. 10-year Treasury yield climbed from 4.41% to 4.453%. According to textbooks, a surge in prices signals a rise in gold prices. However, the exact opposite occurred. The reason for this paradox is important.
3Decoding the Paradox — Short-term Bearishness and Mid-term Bullishness, Why Are Both Right?
The short and medium terms are operating in opposite directions, and in fact, both are correct. The key is the difference in which lens the market is currently using to read the CPI.
The short-term market interpreted it this way: “Prices spike again → The Fed may raise interest rates → The dollar strengthens → Gold is restrained.” This sequence kicked in immediately after the CPI announcement. That is why gold fell.
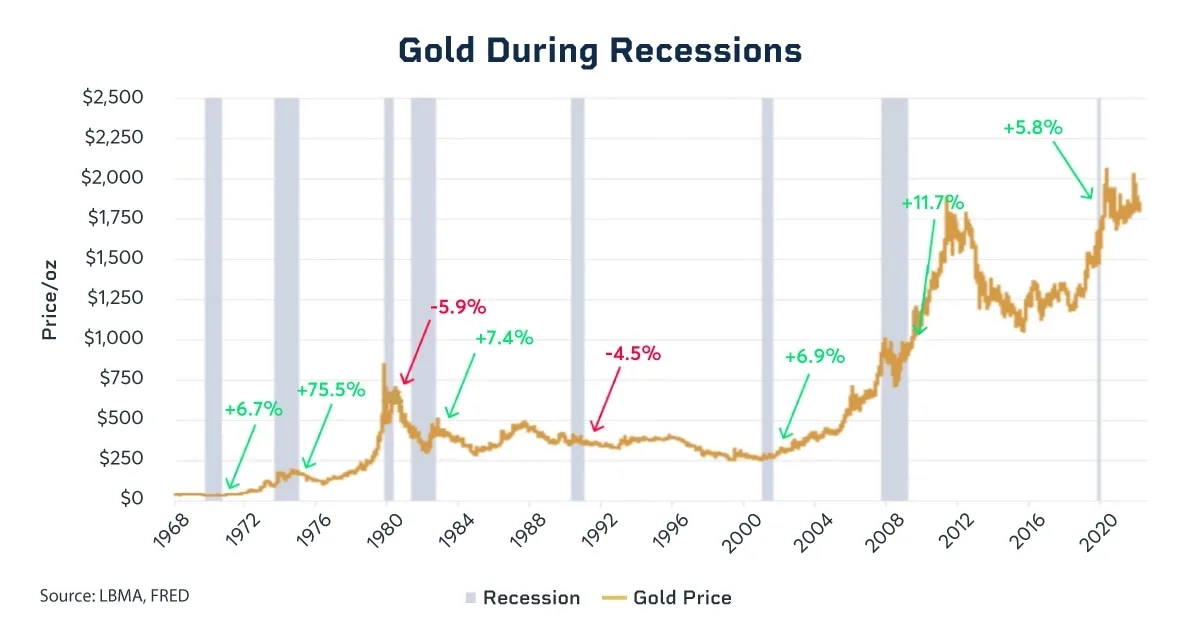
However, the story changes from a medium-term perspective. The fact that inflation remains unchecked simultaneously implies that the Fed cannot lower interest rates. If the economy slows down in a situation where rates cannot be lowered, the economy enters so-called stagflation. It is the worst possible combination: a weak economy, high inflation, and a central bank unable to intervene. Historically, gold has been one of the strongest assets in such phases. As the Fed's inescapable dilemma deepens, confidence in the dollar wavers, and the structural demand for gold comes to the forefront.
| conjuncture | Operation logic | Gold direction |
|---|---|---|
| Short term (now) | CPI shock → Concerns over interest rate hikes → Strong dollar → Gold suppression | ▼ Downward pressure |
| Transition period (3~6 months) | Sustained inflation → Economic slowdown → Concerns over stagflation highlighted | → Direction Search |
| Mid-term (second half) | Deepening Fed dilemma → Decline in dollar confidence → Increase in structural demand for gold | ▲ Strengthening the logic of growth |
Then, when will the transition from the short term to the medium term occur? It is when two conditions are confirmed simultaneously. First, when the monthly CPI rise remains above +0.3% and the figures reveal a stalemate where the Fed is unable to raise or lower interest rates. Second, when market attention shifts from "risk of interest rate hikes" to "risk of economic slowdown." Based on current data trends, this transition is likely to occur in the third quarter of 2026 (July–September) .
4 4 Forces That Structurally Support Gold
Once short-term noise is cleared, the forces structurally supporting gold are still strongly at work. Gold demand for the first quarter of 2026, as announced by the World Gold Council, is 1,231 tons, or $193 billion in value, marking the highest quarterly level on record.
Central bank net purchases for 15 consecutive years
Central banks around the world have been steadily purchasing over 1,000 tons of gold annually for the past 15 years. The share of central banks in total gold demand has doubled from 12% between 2015 and 2019 to 25% in 2024 (World Gold Council). They purchase regardless of interest rate cycles. This represents solid bottom-up demand that remains unshaken by short-term market fluctuations.
Acceleration of De-dollarization
Emerging market central banks are filling their foreign exchange reserves with gold instead of U.S. Treasury bonds. Goldman Sachs has analyzed this trend as a structural one that is difficult to reverse. As geopolitical tensions rise, the pace of dollar outflow accelerates, a trend that cannot be stopped by changes in short-term interest rates.
Continued ETF fund inflows
Global gold ETF net inflows reached an all-time high of $89 billion in 2025. Domestically, interest from retail investors is also rising, with ACE, TIGER, and KODEX gold ETFs recording a 15% year-to-date return. This signals that institutions and individuals are looking in the same direction.
Debasement trade
This is a concept formalized by JP Morgan. As government fiscal deficits accumulate and confidence in fiat currency declines, gold establishes itself as an asset to hedge against currency dilution. It is a demand that operates over the long term, regardless of interest rate cycles.
The median Wall Street consensus suggests upside potential of +8% to +15% from the current price ($5,055–$5,400). It is true that the price has already risen significantly. However, as long as the structural demand base is maintained, this is a matter of timing, not direction.
5Aleph Analysis Model Results — No_GO Judgment, Target Price Is Alive
The probability of short-term success, which was 44% before the CPI was reflected, plummeted to 27%, and the expected value even turned negative. This is the result of running the 4-stage analysis pipeline of Aleph, a professional investment agent.
Aleph's assessment is simple. The direction is correct, but not right now. The mid-term target price ($6,082) remains unchanged, but short-term expectations have turned negative following the CPI shock. We are holding off on aggressive buy entries.

6So What Should We Do Now? — Entry Triggers and Practical Guide
Now is not the time to enter aggressively; instead, it is a period to gradually build up your position through splitting. You should increase your position size when the four triggers below are confirmed simultaneously.
| trigger | meaning | Current status |
|---|---|---|
| Real interest rates fall | When nominal interest rates fall or expected inflation rises, the opportunity cost of gold decreases, making it more attractive. | ⛔ Unsatisfied |
| Dollar shifts to weakness | When the Dollar Index (DXY) turns downward, the dollar and gold tend to move in opposite directions. | ⛔ Unsatisfied |
| ETF fund inflow | This is a signal that institutional investors are returning. This can be confirmed by whether global gold ETFs switch to weekly net inflows. | ⏳ Waiting |
| 50-day moving average recovery | Technically, this is a signal that the trend has reversed. It will be confirmed when the current price settles above the 50-day moving average. | ⏳ Waiting |
Currently, none of the four triggers are met. Based on the data flow, it is highly likely that the conditions will be met in the third quarter of 2026 (July–September) . Now is the time to gradually build up positions while waiting for the triggers.
For those who do not yet own gold — Enter with small amounts (2~3% of portfolio)
You do not invest all at once. You enter gradually over 3 to 5 transactions, and progressively increase your position once the four triggers mentioned above are confirmed. It is a strategy of entering early but not investing a large amount.
For those who already hold — Hold, but keep it below 10% of your portfolio.
If your gold weighting exceeds 10%, consider taking some profits. If it is 10% or less, just hold onto it and wait for a trigger.
| Domestic investment instruments | characteristic | duty |
|---|---|---|
| KRX Spot Gold (411060.KS) | Spot-linked, exchange rate exposure | tax-exempt |
| ACE/TIGER/KODEX Gold ETF | High liquidity, small amounts possible | Dividend income tax 15.4% |
| Gold savings account | Small amounts can be accumulated, varies by bank | Dividend income tax |
| physical gold | Need to possess or store directly | 10% VAT disadvantage |
7Frequently Asked Questions
| question | answer |
|---|---|
| If interest rates don't go down, won't gold not be able to rise either? | That is not necessarily the case. Even between 2022 and 2024, gold rose by 65% despite high real interest rates. This is because central bank buying and de-dollarization demand outweighed the effect of interest rate restraint. Interest rates are just one of many variables. |
| Isn't $4,700 already too expensive? | With the Wall Street consensus median ranging from $5,055 to $5,400, there is still room for an 8% to 15% upside from the current price. However, the Aleph analysis model projects a negative short-term expectation. A split strategy is more effective than entering all at once at a high price. |
| Won't the price of gold drop when the war ends? | As analyzed in the March post, gold actually fell even when war broke out. Real interest rates and the direction of the dollar are more decisive than the geopolitical event itself. The end of a war does not automatically mean a decline in gold. |
| Which is better, KRX Gold or a gold ETF? | In terms of taxes, KRX spot gold (tax-exempt) is advantageous. However, spreads may occur due to low trading volume. ETFs are convenient for small-scale investments or dollar-cost averaging, but a 15.4% dividend income tax applies. You should choose based on your investment amount and strategy. |
Conclusion — Conditions When Paradoxes Become Opportunities
Gold fell immediately after the announcement of the 3.81% CPI today. However, this does not end the story for gold. While the short-term market interpreted this as a "possibility of an interest rate hike," as inflation remains unchecked, the Fed's dilemma deepens and confidence in the dollar wavers. Historically, gold has been the strongest asset in such phases.
The judgment of the Aleph analysis model is clear. The direction is correct. However, it is not right now. A strategy of gradually building positions while waiting for these four triggers—falling real interest rates, a shift to a weaker dollar, renewed ETF inflows, and a recovery of the 50-day moving average—is the most rational choice for preparing for the second half of 2026.
There is only one condition for a paradox to become an opportunity: knowing the turning point in advance and waiting calmly while others are panicking over CPI figures.
All figures and analyses in this article are for informational purposes only and do not constitute investment advice. The results of the Aleph analysis model are probabilistic judgments based on specific conditions and time points, and do not guarantee actual investment outcomes. All investment decisions and responsibilities rest with the individual, and consulting with a professional financial advisor before making important decisions is recommended. Data is accurate as of May 12, 2026.
📌 Was this analysis helpful?
In the next post, we plan to cover “Q3 2026 Gold Trigger — Real Interest Rates and Dollar Index, Where the Turning Point Comes.”
We continuously track gold and macro investment trends. If you receive notifications, you won't miss out.
How this content was produced
Aleph's research AI agent assisted with collecting and analyzing public data, creating charts and visuals, and structuring the draft. Davar personally reviewed and edited the sources, figures, reasoning, and final conclusions.
This content is for informational purposes only and is not personalized investment advice or an individual stock recommendation. Read the full disclaimer

Davar
Davar builds and operates Aleph's research AI agent and writes and reviews analysis on macroeconomic developments and AI industry trends.
© Aleph. All rights reserved.