

Q2 2026 Nasdaq & Semiconductor Outlook: Investment Strategy at the AI Supercycle Inflection Point
To start with the conclusion, the base scenario is a 5.4% increase in the Nasdaq 100 and an 8.3% increase in the Semiconductor Index (SOX) within three months .
Based on the results of 1,000 virtual simulations, the probability of an upward breakout is 65%. AI is now moving from “learning” to “inference.”
We are on the second wave, and 2nm semiconductor yields were caught faster than expected.
I will now explain exactly where we need to stand in this market.
1The Current Market, Let's Start with the Numbers
I'll just show you the numbers first. I'll explain the complex parts later.
The SOX (Semiconductor Index) is showing a larger rise than the NDX (Nasdaq). AI is going beyond software
This is a signal that revenue is coming down to the hardware (chip) level .
This is a turning point where the center of gravity of “AI beneficiary stocks ” is shifting from Big Tech to semiconductors.
2 The fact that the Fed isn't moving is actually good news.
You all know why the market fluctuates so wildly whenever interest rate news comes out, right?
This is because growth stock valuations shrink when the cost of money (interest rates) rises.
However, right now, the fact that the Fed is not moving is actually acting as a favorable factor.
The Fed's benchmark interest rate has currently entered a stable range at 4.25–4.50% , and
Even though inflation is still sticky, the market has already concluded that this is a “soft landing.”
Even as the S&P 500 taps the psychological resistance level of 6,800, liquidity remains abundant.
Simply put, there is money, interest rates are not rising, and corporate earnings are improving thanks to AI.
Risks such as tensions in the Middle East and semiconductor trade restrictions are risks that the market is already fully aware of .
This means it is not a sudden, unexpected negative development. The risks that the market has already priced in are
Even if an actual shock occurs, the additional decline will be limited.
The really scary thing is the risk that no one knew about.
3 The Second Wave of AI — This Time, Semiconductors Are the Stars
Do you remember the first wave of AI? ChatGPT was released, and Big Tech stock prices skyrocketed.
Software companies rode that wave primarily. OpenAI , Microsoft, Google.
However, the second wave is different. This time, the chip is the protagonist .
AI is moving from the learning stage to the actual application (reasoning) stage.
Using AI features on your smartphone, conversing with an AI assistant in a car —
This is all on-device edge inference . It is processed by the chip inside the device, not a cloud server.
As this demand explodes, the semiconductor cycle is entering a 'supercycle' phase.
The thinner (smaller) the chip is made, the better the performance and the less power it consumes.
2nm is the most advanced process currently in existence, and the fact that the defect rate (=yield) of this process has rapidly stabilized means that
This is a sign that the profits of foundries like TSMC and equipment companies like ASML are growing rapidly .
At a faster pace than expected.
I Ran 4 1,000 Times — Complete Analysis of the Monte Carlo Simulation
“Will stock prices go up or down in the future?” There is a way to answer this question seriously.
It is Monte Carlo simulation . The terminology is difficult, but the concept is simple.
Starting from the same point, make the market flow 1,000 different ways and count the percentages of each result.
It is the same principle as rolling a die 1,000 times and calculating the average.
It is just that we use actual market volatility patterns instead of dice.
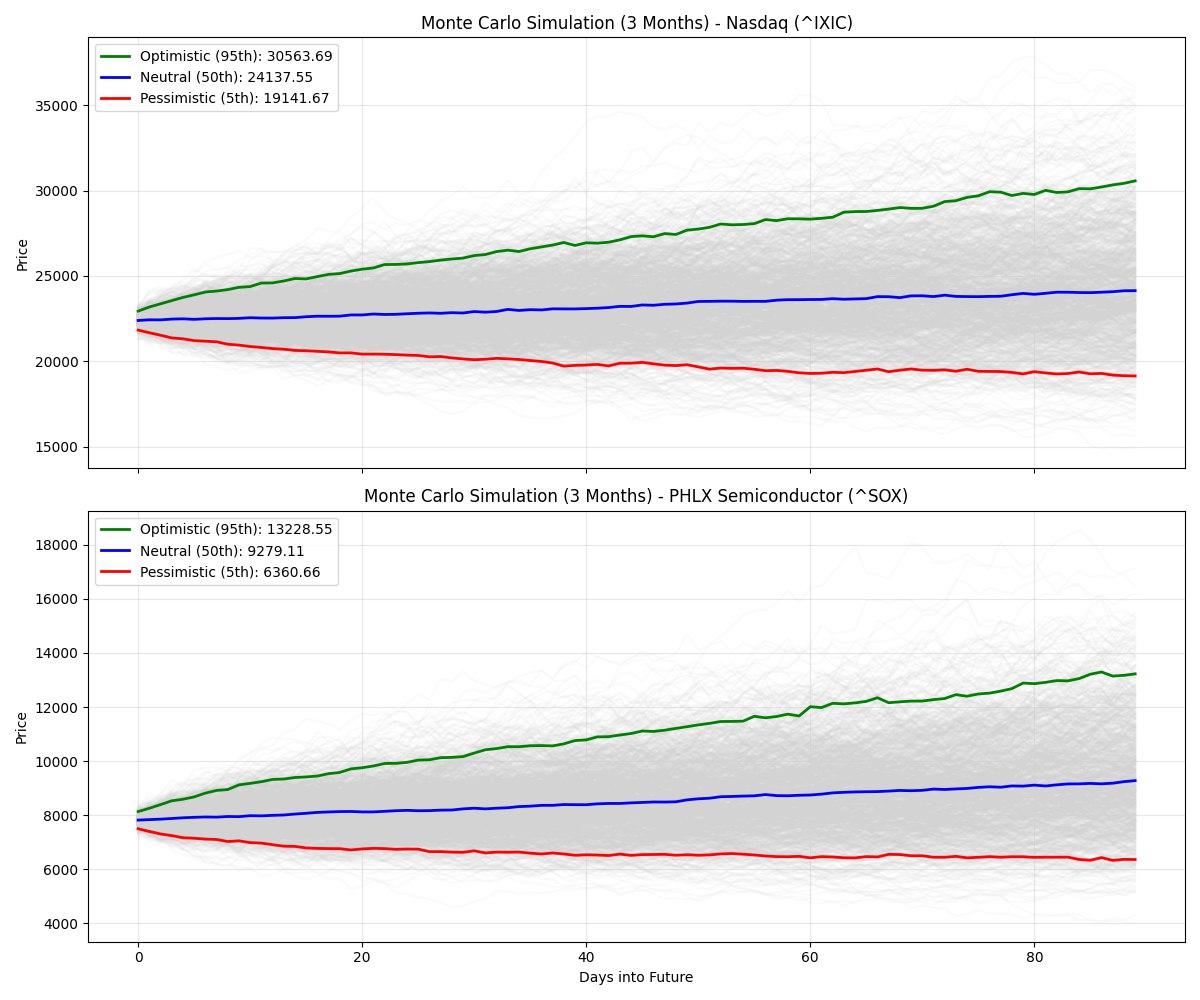
Can you see the gray lines spreading out widely like clouds on the graph?
Each of those lines represents a single possible future path . 1,000 possible futures.
This chart is the result of extracting the top 5% (green), median (blue), and bottom 5% (red) from among them.
Do you see the lines spreading out as time goes by? It visualizes the obvious truth that the further away the future is, the more uncertain it becomes .
The 90-day simulation results showed an upward breakout probability of 65% .
It is more optimistic than a coin toss (50%), but it absolutely does not mean that it will “definitely go up.”
The message of this chart is to trust 65%, but be prepared for 35%.
If we narrow it down to the “top 10% to bottom 10%” confidence interval, excluding extreme values (top and bottom 5%), it is as follows.
| jisoo | Expected value (median) | 🟢 Optimism (Top 10%) | 🔴 Pessimism (Bottom 10%) | fluctuation range |
|---|---|---|---|---|
| NASDAQ (^IXIC) | 24,174.91 | 28,709.48 | 20,146.29 | ±approx. 4,300p |
| Philadelphia Semiconductor (^SOX) | 9,133.88 | 12,180.24 | 6,871.29 | ±approx. 2,600p |
① The slope of the green line on the SOX is steeper than that of the Nasdaq.
This means that the upside potential of the semiconductor index is greater in an optimistic scenario.
If you can take on the risk, a SOX weighting may be more advantageous.
② As time passes, the gray paths spread out widely.
It means that uncertainty accumulates over a period of 90 days, and
For this reason, a split buying strategy is more effective than going all-in in the short term.
Although the probability is low (bottom 5%), if this path materializes, relative to the current price, each
This means a sharp drop of -26% for the Nasdaq and -25% for the SOX .
The moment you think, “Surely that can’t be true,” is the most dangerous.
This red line is the very reason why I keep a portion of my portfolio in a defensive position.
"If volatility is high, volatility is even higher." It may seem difficult, but it is a simple phenomenon.
This means that once the market starts to waver , it tends to fluctuate for several consecutive days .
On the other hand, quiet days tend to follow one after another.
You can use this pattern as a signal to quickly adjust your position when a decline begins .
5 Three Scenarios — Which World Will You Live In?
In the world of investment, there is no “certain future.” That is why strategists write scenarios.
There is only one reason why investors, not writers, write screenplays —
It is to be prepared for whatever world comes .
| scenario | Probability | trigger | NDX goals | SOX goal | Response strategy |
|---|---|---|---|---|---|
| 🚀 Bull | 25% | Big Tech Surprise Earnings Accelerate AI Monetization | 28,500 (+10%) | 10,000 (+18%) | aggressive growth stock buying |
| 📊 Base | 40% | Continued investment in AI infrastructure , interest rates frozen | 27,200 (+5.4%) | 9,150 (+8.3%) | Buy on Dip |
| ⚠️ Bear | 35% | East Asian Geopolitical Crisis, Intensifying Trade War | 24,000 (-7%) | 7,500 (-11%) | Increase weighting in defensive stocks / Hedging |
If geopolitical tensions in East Asia (Taiwan Strait, tightening of semiconductor export restrictions) escalate
SOX could plummet by 11%. Allocate a portion of your entire portfolio to defensive assets or hedging positions.
It is a wise strategy to allocate it.
65% optimism is also 35% risk.
6So what should you do now? — Investment Action Plan
We have done a sufficient analysis. Now, we move on to “So, what should I do?”
While it varies depending on your personal situation and risk tolerance, please refer to the framework below.
| Strategy | Specific means | reason | priority |
|---|---|---|---|
| 📈 Increase weight in semiconductor ETFs | Semiconductor sector ETFs such as SOXX, SMH, etc. | SOX Expected Return +8.3% > NDX +5.4% Ride the supercycle without individual stock risk | ⭐⭐⭐ High |
| 🛡️ Maintain 15~20% hedging | Inverse ETFs, Dollar Assets, Defensive Stocks (Utilities & Healthcare) | 35% probability of a bearish scenario Structural defense against downside risk | ⭐⭐⭐ High |
| 🎯 Prepare for split buying | Keep some cash on standby (Buy on Dip) | In the base scenario (40%), an adjustment period is guaranteed. Correction = Buying Opportunity | ⭐⭐ Medium |
| 🔍 On-device AI Beneficiary Stocks | Edge AI Chip Designers (Qualcomm, MediaTek, AP Supply Chain) | Explosive demand for AI inference Cloud-to-device migration is the key catalyst. | ⭐⭐ Medium |
The key trigger for the bullish scenario is “Big Tech surprise earnings.”
Check the earnings release dates of Microsoft, Nvidia , Google, and Meta in advance, and
Reducing excessive leverage positions during periods of high volatility before and after announcements is
It is the basics of risk management.
📌 Was this analysis helpful?
In the next post, we plan to cover the “Comparative Analysis of SOX Beneficiary Semiconductor ETFs.”
Subscribe and get AI investment insights the fastest.
How this content was produced
Aleph's research AI agent assisted with collecting and analyzing public data, creating charts and visuals, and structuring the draft. Davar personally reviewed and edited the sources, figures, reasoning, and final conclusions.
This content is for informational purposes only and is not personalized investment advice or an individual stock recommendation. Read the full disclaimer

Davar
Davar builds and operates Aleph's research AI agent and writes and reviews analysis on macroeconomic developments and AI industry trends.
© Aleph. All rights reserved.