

“Aleph, what do you think of HL Mando?” “And Hyundai Mobis?” — I’ve been asked this question way too much . 😅
So instead of just answering verbally, I ran 10,000 simulations.
We are now revealing the stock price trajectory for the next three months, derived from Monte Carlo simulation.
Spoiler: For both stocks, it is neither a "buy unconditionally" nor a "sell unconditionally" recommendation. Let's look at what the numbers tell us.
Since the last post, there has been a flood of requests for analysis regarding HL Mando and Hyundai Mobis.
From DMs and comments to emails—this post was created thanks to everyone who requested it. Thank you!
For those of you who have been waiting, I will now answer with data.
1 What is Monte Carlo Simulation? — Understand in 3 Minutes
The name sounds a bit like a casino, doesn't it? 🎰 It was actually named after Monte Carlo, the casino city of Monaco.
Just as it borrows its name from the mecca of probability games, this analysis method is also a 'technique for handling uncertainty.'
It is similar to a weather forecast. When they say, “There is a 70% chance of rain tomorrow,” the Meteorological Agency runs thousands of scenarios and counts the percentage of cases where it actually rains.
It is the same for stocks. It involves “simulating 10,000 possible futures based on the stock’s past volatility data to calculate which range is most likely to be formed.”
Since we are looking at the results of tens of thousands of experiments rather than a single prediction, it is much more scientific than a simple "it seems likely to go up."
The meaning of the three lines shown in the graph is as follows.
🔴 Red line (Pessimistic, 5%): Worst-case scenario — Pessimistic results for the bottom 5%.
🔵 Blue line (Expected, 50%): Most likely median — “Textbook prediction”.
🟢 Green Line (Optimistic, 95%): Top 5% Optimistic Scenario — “If I hit the jackpot, it’ll be this much”.
The gray lines are the individual paths from 10,000 simulations. Don't underestimate them just because there are many; those are all 'possible futures'.
2HL Mando (204320.KS) — The Potential of By-Wire Technology
Current Price: 54,400 won. HL Mando is an automotive parts company affiliated with the HL Group (Halla Group) . You ask what kind of company it is right now?
Simply put, it is a “company that digitizes the steering wheel, brakes, and suspension.”
It is a key player in By-Wire technology — technology that controls a car using only electrical signals without mechanical connections.
Ultimately, this technology is essential for autonomous vehicles. It is a top-tier future growth engine.
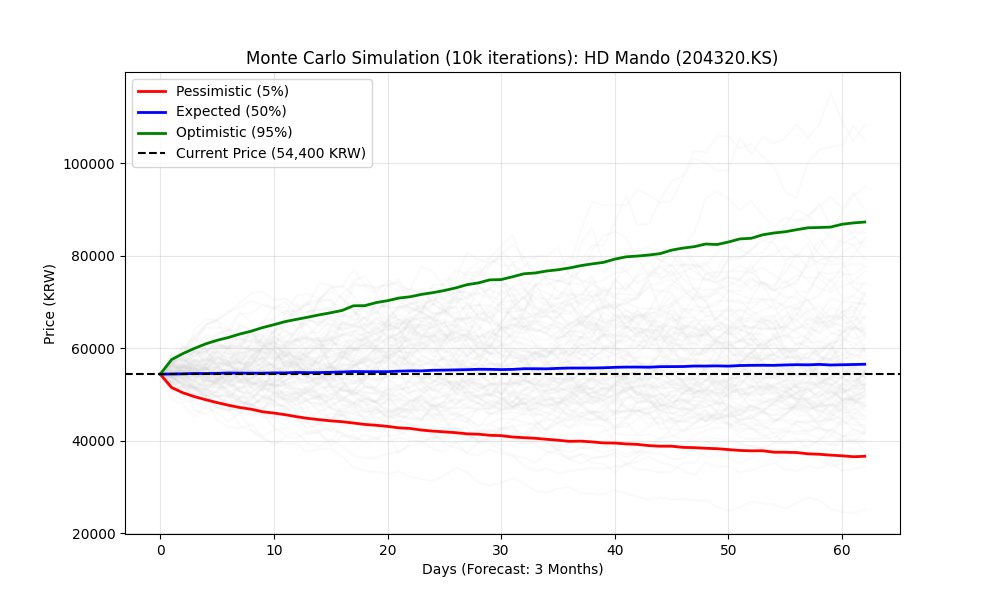
Based on the current price of 54,400 won, the optimistic (95%) scenario suggests up to approximately 88,000 won, while the pessimistic (5%) scenario suggests up to approximately 37,000 won.
Can you see the blue line (Expected) moving almost horizontally at the current price before rising slightly?
This is a signal that “the current price is close to a reasonable level.”
The steep angle of the green line's rise represents potential upside in the event of a By-Wire technology momentum surge.
The downward slope of the red line is relatively gentle — it is a risk structure that declines gradually rather than plummeting.
In short: “It has explosive potential, but the key is the speed at which its technological value is realized rather than immediate momentum for a surge.”
By-Wire technology is an essential component for autonomous driving levels 3 and above. Order momentum could revive with the full-scale commencement of Level 3 mass production by Hyundai and Kia in 2026.
The optimal strategy suggested by Monte Carlo is to approach it from a medium-term perspective of 6 to 12 months rather than short-term trading.
Split buying baseline: It is worth considering increasing your position in the range of 52,000 won or lower .
3Hyundai Mobis (012330.KS) — Hyundai Motor Group's core parts and robotics component supply axis
Current price: 430,000 won. Hyundai Mobis is a key parts supplier for Hyundai Motor Group.
Recently, the role of supplying components such as robot actuators in cooperation with Boston Dynamics is gaining prominence , and
The structure is such that the autonomous driving software is handled by the subsidiary 42dot.
Simply put: It is the “company responsible for the core components of all means of transportation manufactured by Hyundai Motor Group.”
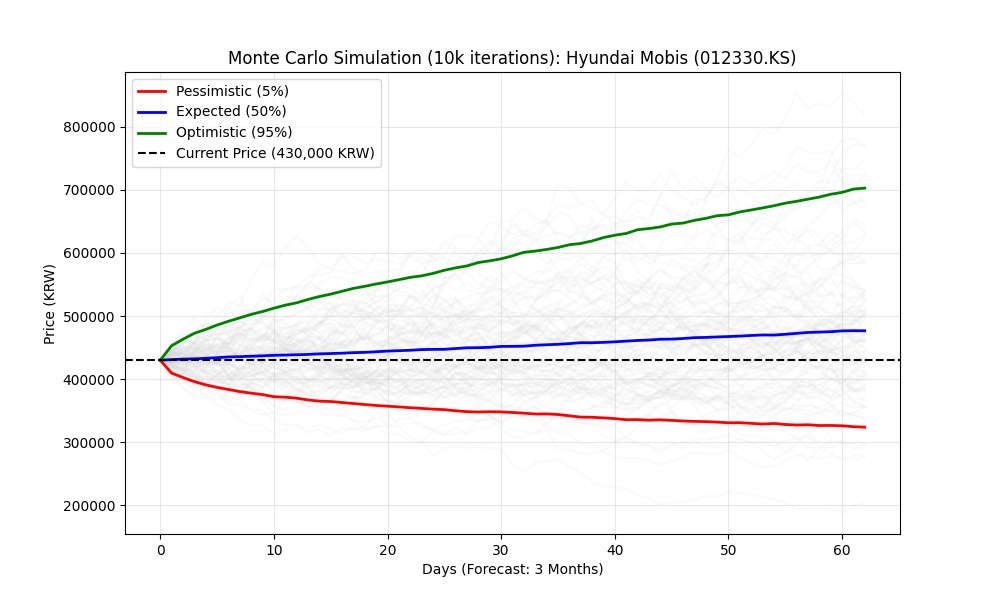
Based on the current price of 430,000 won, the optimistic (95%) scenario suggests up to approximately 705,000 won, while the pessimistic (5%) scenario suggests up to approximately 325,000 won.
There is a notable point compared to HL Mando.
The blue line (Expected) is trending gradually but steadily upward .
This is exactly the meaning of a “stable upward trajectory.”
The rise in the optimistic scenario (green line) is large, and the fall in the pessimistic scenario (red line) is relatively gentler than that of HL.
In short: “It is a high-priced stock, but has a structure where expected value clearly trends upward” — the ratio of expected return to risk is favorable.
It is the biggest beneficiary of Hyundai Motor Group's expansion into electrification and robotics . It plays a key role in the group's growth, including supplying robot components through collaboration with Boston Dynamics and internalizing SDV software through its subsidiary, 42dot.
The implication of the simulation is that a stock price in the 430,000 won range is close to the lower end of the historical band— a level worth considering for long-term investors .
Split buying baseline: It is worth considering a first entry in the range of 415,000 won or lower .
4 What if you compare the two stocks side by side?
“So, which one is better?” To be honest— since their personalities are different, comparing them is a flawed question in itself .
In baseball terms, HL Mando is a 'triple hitter,' and Hyundai Mobis is a 'high on-base percentage leadoff hitter.'
I will summarize it for you in the table below.
| Comparison items | HL Mando (204320) | Hyundai Mobis (012330) |
|---|---|---|
| The current price | 54,400 won | 430,000 won |
| Key Theme | By-Wire / Electrification Components | Electrification & Robotics Components / 42dot SDV |
| Optimistic scenario (95%) | ~88,000 won (+62%) | ~705,000 won (+64%) |
| Expected Scenario (50%) | ~57,000 won (+5%) | ~480,000 won (+12%) |
| Pessimistic scenario (5%) | ~37,000 won (-32%) | ~325,000 won (-24%) |
| Downside risk | Relatively high | Relatively low |
| Investment nature | High-risk, high-return growth stocks | Stable, upward-trending blue chip |
| Recommendation tendencies | Aggressive investment type (30s~40s) | Risk-neutral to stability-seeking type |
5The Limitations of Monte Carlo — At Least Know This Before You Use It
Let me be honest. Even the Monte Carlo simulation is not a perfect prediction.
It is actually dangerous to blindly trust this analysis method without understanding its limitations.
① Based on historical data : The simulation is based on historical volatility. Completely new Black Swan events (e.g., sudden war, technological innovation shock) are not reflected.
② The Pitfalls of the Normal Distribution Assumption : Real-world stocks exhibit a "fat tail" phenomenon, causing extreme crashes to occur more frequently than in theory.
③ Corporate Fundamentals Not Reflected : Internal corporate factors such as earnings, new orders, and management changes are not directly reflected in this model.
Conclusion: Monte Carlo is a 'compass,' not a 'GPS.' Refer to it for direction, but make your own judgment.
6So what do you want me to do now?
Hyundai Mobis: Consider first split purchase below 415,000 won
As the expected scenario (blue line) shows a steady upward trend, the current price range is close to an attractive zone from a mid-to-long-term perspective .
Do not try to invest everything at once; approach it in three stages: 415,000 won → 400,000 won → 385,000 won .
It is more advantageous to monitor the flow of news regarding NVIDIA collaborations together.
HL Mando: Enter a small position in the range below 52,000 won.
The By-Wire theme has a clear long-term growth story, but short-term momentum is still uncertain .
It is better to adopt a strategy of entering with a small amount within 5% of the total portfolio first, and then increasing the weight when news regarding Hyundai and Kia's Level 3 autonomous driving comes out .
For now, approach this only as the initial stage of position building.
For both stocks: Stop-loss is mechanically managed at -10%.
No matter how good the analysis is, the market can be wrong.
If the pessimistic scenario (red line) materializes, HL Mando could fall by -32% and Hyundai Mobis by -24%.
The basic principle of asset protection is to close your position when it reaches -10% from the purchase price and look for a re-entry.
Drive by numbers, not emotions.
The most reasonable design suggested by this simulation is to approach Hyundai Mobis as a “stable growth axis of the portfolio” and HL Mando as a “small satellite position for betting on growth themes.”
It is not recommended to include both stocks with equal weighting from a risk management perspective.
📌 Next Analysis Preview
We are also preparing a Monte Carlo analysis of the two defense stocks , Hanwha Aerospace and LIG Nex1, which have been frequently requested.
If there is a stock you would like analyzed, please leave a comment!
How this content was produced
Aleph's research AI agent assisted with collecting and analyzing public data, creating charts and visuals, and structuring the draft. Davar personally reviewed and edited the sources, figures, reasoning, and final conclusions.
This content is for informational purposes only and is not personalized investment advice or an individual stock recommendation. Read the full disclaimer

Davar
Davar builds and operates Aleph's research AI agent and writes and reviews analysis on macroeconomic developments and AI industry trends.

© Aleph. All rights reserved.