
President Trump issued a 48-hour ultimatum to Iran, threatening to destroy power plants if the Strait of Hormuz is not opened. Iran immediately retaliated, vowing to strike the entire energy and desalination infrastructure of the U.S. and Israel. The war between Russia and Ukraine has been ongoing for four years, and the Middle East has been at war for four weeks. Oil prices have surpassed $100 per barrel. In this situation, only one question remains in investors' minds: “Should I sell now?” Today, Aleph will provide the answer using 1,000 Monte Carlo simulations and actual data from 2022 to 2025.
1What is happening in the world right now
As of March 2026, wars are simultaneously underway in two locations around the globe. It is difficult to find a precedent since the Cold War for geopolitical shocks of this magnitude to overlap.
On March 22, 2026, President Trump wrote to Truth Social: “If Iran doesn’t FULLY OPEN, WITHOUT THREAT, the Strait of Hormuz, within 48 HOURS from this exact point in time, the United States of America will hit and obliterate their various POWER PLANTS, STARTING WITH THE BIGGEST ONE FIRST!” — This is a declaration that if the Strait of Hormuz is not fully opened within 48 hours, Iran will destroy its power plants, starting with the largest one.
Iran's reaction was immediate. A spokesperson for the Khatam al-Anbiya Command under the Iranian Revolutionary Guard Corps stated, "If Iran's energy infrastructure is attacked, we will strike all energy, IT, and desalination facilities belonging to the United States and Israel in the Middle East." Desalination facilities are critical infrastructure that supplies drinking water to Israel and Gulf countries. The Speaker of the Iranian Parliament also warned, "Regional energy and oil infrastructure will be irreversibly destroyed, and oil prices will rise for an extended period."
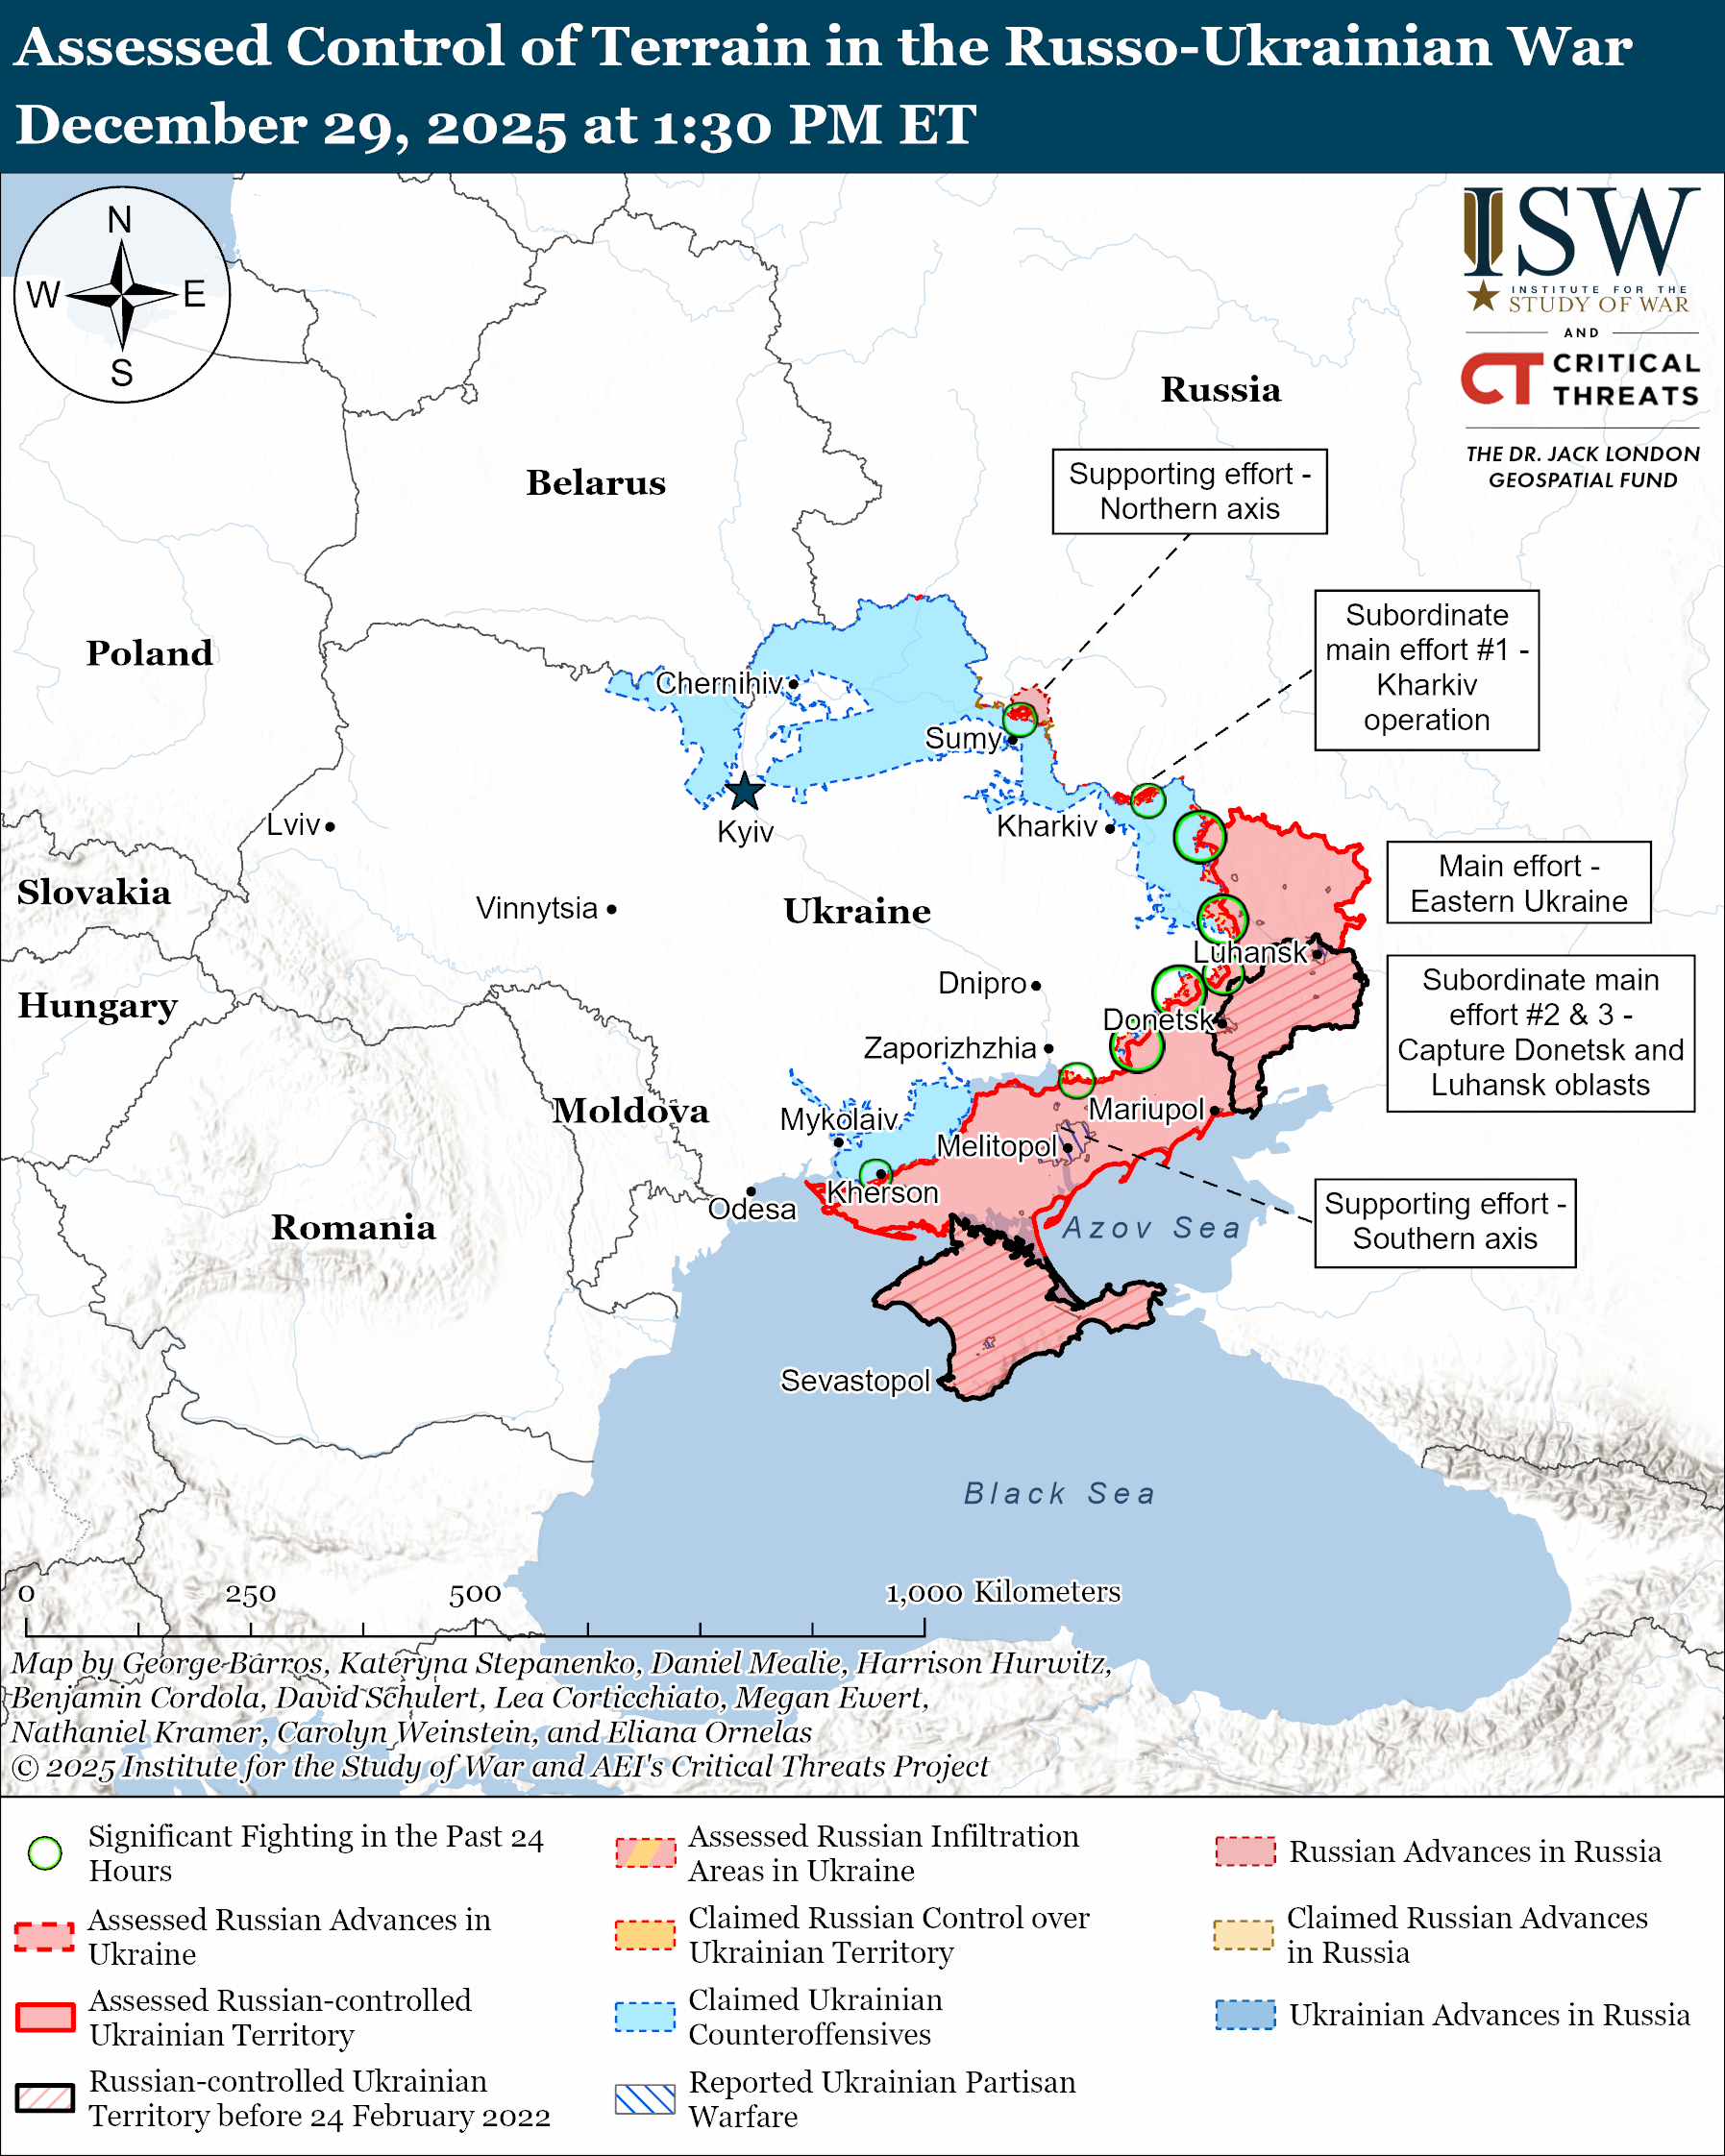
There are three differences from past geopolitical risks.
① Simultaneous Impact — Europe (Russia-U.S.) and the Middle East (U.S.-Iran) are proceeding simultaneously. Not a dispersed shock, but a complex shock.
② Direct hit to energy routes — Two key routes, Hormuz (20% crude oil) and the Black Sea (grain and fertilizer), struck simultaneously.
③ Expansion into an Infrastructure War — Threat to damage power plants, desalination facilities, and IT infrastructure. Directly linked to the private economy.
2 Signals Sent by the Fear Index — How to Read the VIX
The VIX (Volatility Index) is a numerical representation of market fear. This number, often called the "Wall Street fear thermometer," is something even novice investors must know. A higher VIX indicates that the market is afraid, and paradoxically, it also serves as a signal that a buying opportunity is approaching .
| VIX section | Market sentiment | Historical significance | Investor behavior |
|---|---|---|---|
| 10~15 | 🟢 Peaceful | Typical phase of a bull market | Continued normal investment |
| 15~25 | 🟡 Boundary | Section of increasing uncertainty | Slight increase in hedge weight |
| 25~40 | 🟠 Horror | Geopolitical and economic shock zone | Time to prepare for split buying |
| 40 or more | 🔴 Extreme Horror | COVID-19 and financial crisis levels | Historical buying opportunity zone |
3What History Tells Us — “After the War, the Market Eventually Rised”
For those who have just started investing, times like these are the most difficult. The news is filled with stories of war and crisis, stock prices are volatile, and talk of "selling everything" is rampant. However, historical data tells a completely different story.
① After 9/11, 2001 — S&P 500 recovered more than half of its losses in one month. Turned positive one year later.
② The start of the Iraq War in 2003 — The market actually rebounded immediately after the war began due to the resolution of uncertainty. “The start of the war was the bottom.”
③ 2022 Russia-U.S. Invasion — S&P 500 recovers after a short-term plunge. Defense and energy sectors actually surge.
Of course, you might think, “This time it’s different.” The blockade of Hormuz, threats to strike power plants, and even desalination facilities—the scale is certainly different. So, in the next section, we simulated “hold vs. sell” using actual data.
4Sell or Hold On — 1,000 Simulation Results
The most common mistake novice investors make is panic selling driven by fear. They think, "I can just buy back later if it drops further," but the market rises on its own while we wait. We verified this with data.
Simulation Design: 1,000 simulations over 3 years (756 trading days) using a hybrid model combining LightGBM, GARCH, and Monte Carlo. Based on an initial asset of $100,000, a -20% geopolitical shock was applied on day 100 (gradual recovery following a surge in volatility).
| scenario | 3-year average assets | median | Bottom (5th) | Top (95th) | Probability of exceeding the baseline |
|---|---|---|---|---|---|
| 📊 Baseline (No impact) | $133,102 | $128,001 | $81,803 | $196,677 | — |
| 🟢 Plan A — Maintain Retention | $126,565 | $109,043 | $42,914 | $267,103 | 39.8% |
| 🔴 Option B — Re-enter after 6 months of panic selling | $119,108 | $109,055 | $59,071 | $210,773 | 34.9% |
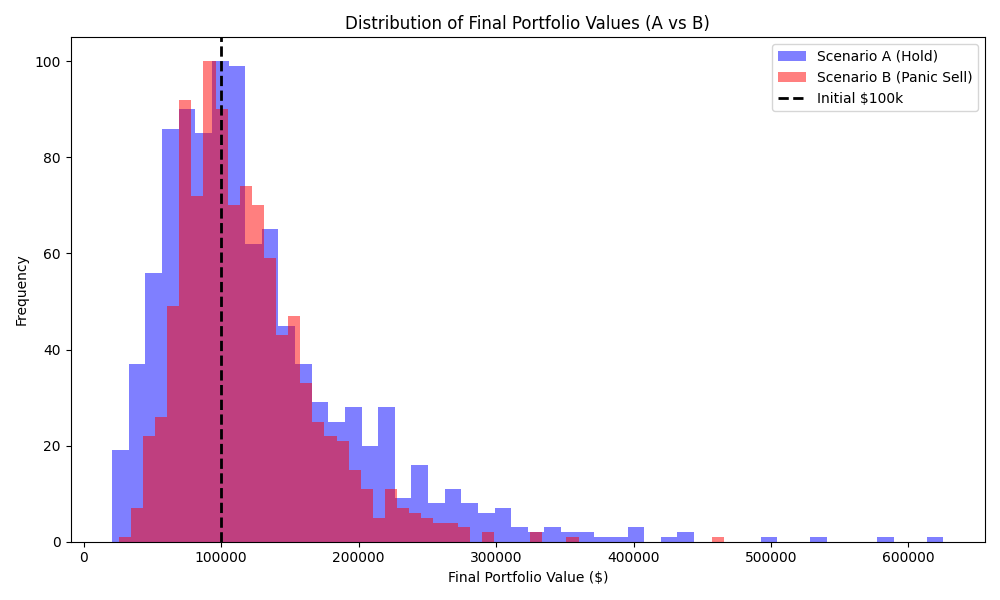
Option A (hold) averages $126,565 , and Option B (panic selling) averages $119,108 . After 3 years, the average difference is $7,457 (approximately 6.3%) .
More importantly, the upper band: Plan A's upper limit is $267,103 , and Plan B's is $210,773 . The hold strategy fully captures the recovery rebound.
Option B is advantageous only in the bottom (5th) scenario: $59,071 vs $42,914. In the worst-case scenario, Option B is more defensive.
Conclusion: Trusting in a good portfolio and holding on is a statistically superior strategy . However, this presupposes a “good portfolio.”
If the market rebounds during a six-month cash holding period, you miss out on the entire gain. Historically, 50% of stock price recovery is concentrated within just 20 trading days after a bottom. Spending “these 20 days” in cash significantly damages long-term returns.
5Then Which Assets Are Strong in Crises? — 2022–2025 Actual Data
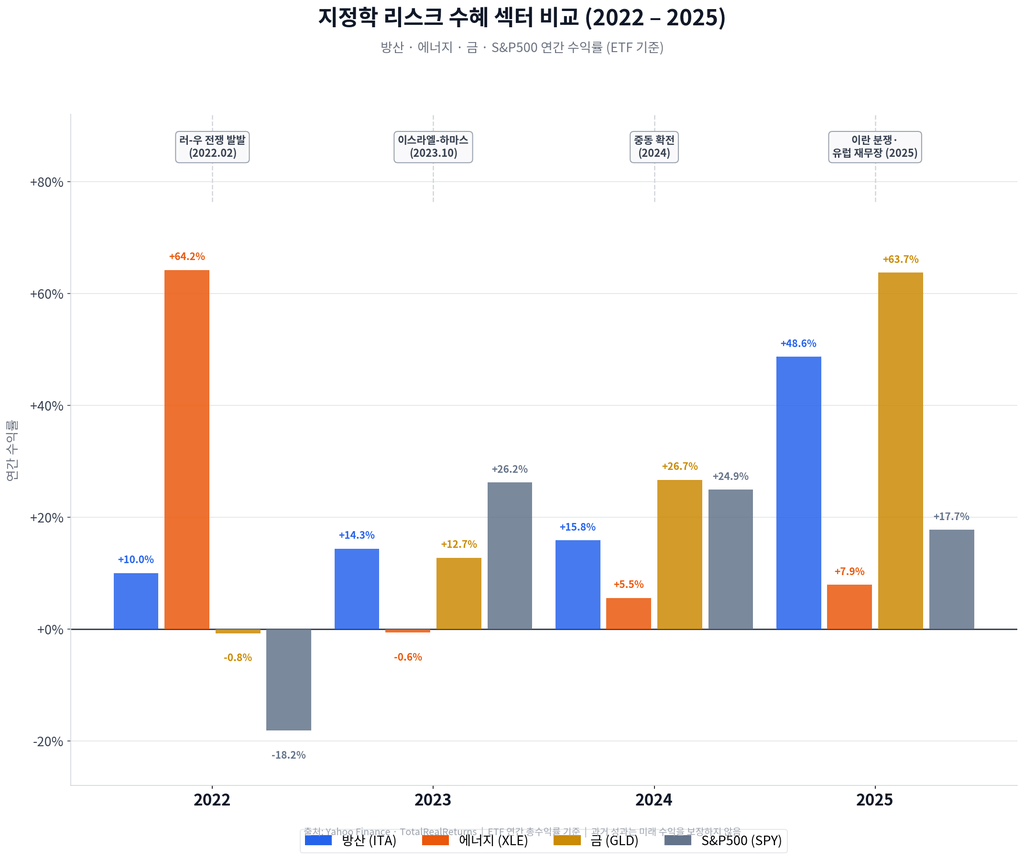
Although I advised holding out, not all assets recover at the same pace. There are sectors that are particularly strong in an environment of geopolitical risk. Let’s look at actual ETF return data for the four-year period from the 2022 Russia-U.S. war to the 2025 Iran conflict.
| Year / Event | Defense ITA | Energy XLE | Gold GLD | S&P 500 SPY |
|---|---|---|---|---|
| 2022 (Russia-U.S. War) | +10.0% | +64.2% | -0.8% | -18.2% |
| 2023 (I-Hamas War) | +14.3% | -0.6% | +12.7% | +26.2% |
| 2024 (Middle East escalation) | +15.8% | +5.5% | +26.7% | +24.9% |
| 2025 (Iran Conflict · European Rearmament) | +48.6% | +7.9% | +63.7% | +17.7% |
The pattern is clear in the four-year data. Defense (ITA) strengthened as geopolitical tensions escalated, while Gold (GLD) surged explosively during periods of extreme uncertainty. Energy (XLE) delivered unrivaled performance during direct hits to energy routes, such as the Russia-U.S. war. Although the S&P 500 performed well over the long term, incorporating hedge sectors significantly reduces volatility in a risk environment.
🏦 Safe Haven Assets — The Role of Gold, Dollar, and Bonds
6How Should I Adjust My Current Portfolio?
Theory is sufficient. Now it is time for practice. I will present specific weightings for each risk tolerance on how to adjust your current portfolio. There is only one core principle: adjust hedge weighting instead of panic selling .
① Do not sell your entire position — even experts find it difficult to time the re-entry after 6 months.
② Weighting is key — Replacing 20–30% of existing positions with hedge assets is sufficient.
③ Split Buying and Selling — Do not change everything at once; adjust in three stages.
| Asset items | ⚖️ Balanced type (Maintain current holdings) | 🛡️ Defensive type (Risk reduction) | 🚨 Crisis Preparedness Type (Maximum Defense) |
|---|---|---|---|
| 📈 Growth Stocks (Existing Position) | 60% | 45% | 30% |
| 🛡️ Defense ETFs (ITA, DFEN, etc.) | 10% | 15% | 20% |
| ⛽ Energy ETFs (XLE, XOM, etc.) | 10% | 15% | 20% |
| 🥇 Gold ETFs (GLD, IAU, etc.) | 10% | 15% | 20% |
| 💵 Cash · Short-term Bonds (MMF · SGOV) | 10% | 10% | 10% |
If direct investment in overseas ETFs is difficult, you can achieve a similar effect with domestically listed ETFs.
Defense:
TIGER 글로벌방산&우주 · Energy: TIGER 미국S&P500에너지(합성) · Gold: KODEX 골드선물(H) · Short-term Bonds: TIGER CD금리투자KIS(합성)📋 Self-assessment of my portfolio type
| question | YES → Defensive Enhancement | NO → Maintain Balance |
|---|---|---|
| Do you have trouble sleeping at night if your portfolio drops by 20%? | ✅ Defensive type or higher | Maintaining balance |
| Is the investment period less than 3 years? | ✅ Defensive type or higher | Maintaining balance |
| Do energy-related stocks make up 30% or more of the portfolio? | Already sufficient exposure (no additional energy needed) | Consider adding energy ETFs |
| Is the proportion of Korean export stocks high? (Samsung Electronics, Hyundai Motor, etc.) | ✅ Exchange rate hedging needed (Gold/Dollar added) | Limited impact on exchange rates |
7 5 Things Investment Beginners Must Know
Here are five key principles for those starting to invest for the first time in a geopolitical risk environment. These principles prevent actual losses more effectively than complex analysis.
Separate news and investments
News feeds on clicks by selling fear. Even when headlines like "War Breaks Out" appear, the market has often already reflected that information. Making same-day trading decisions based on the news is the most dangerous investment habit. Allow at least a 24-hour cooling-off period between gathering information and making investment decisions .
Dispersion is defense.
Concentrating all your investments in a single stock or sector is particularly dangerous in an environment of geopolitical risk. A portfolio diversified across defense, energy, gold, growth stocks, and cash will not collapse in a single blow under any scenario. Putting all your eggs in one basket is risky even in a calm market, and fatal in a crisis market.
A VIX of 30 or higher is actually a buy signal.
Paradoxically, the scariest times are often the best times to buy. Historically, investors who dollar-cost averaging on the S&P 500 when the VIX was above 40 achieved average double-digit returns within a year. When fear reaches its peak, start dollar-cost averaging on blue-chip stocks and ETFs you have been interested in .
Set your principles in advance.
Impromptu judgments are almost always wrong in situations of fear. As you read this, set your rules in advance. If you set specific numbers—such as adding 5% to your hedge position upon a -15% drop, starting split buying upon a -25% drop, and partially liquidating your hedge upon a +30% rise— you will not waver even in the midst of fear.
This crisis will end — but preparation is necessary.
All geopolitical crises in history have ended. The Cold War, the Gulf War, 9/11, and COVID-19, for that matter. However, the exact timing of when they will end cannot be predicted. Therefore, what matters is not when the crisis ends, but whether your portfolio can withstand it while it persists . The weight of your hedges serves as that very support.
8 3 Things to Do Right Now
Immediately — Check my portfolio's energy exposure
If the blockade of the Strait of Hormuz is prolonged, energy prices will continue to rise. If your energy portfolio weight is less than 10%, consider adding a small amount (5%) of XLE or a domestic energy ETF. Conversely, the risk increases for aviation, chemical, and logistics stocks that have a high proportion of energy imports.
This week — Include 5–10% in gold ETFs
Gold is the most proven hedge against geopolitical uncertainty. As demonstrated by the remarkable performance of +63.7% in 2025, gold's role is clear in an environment of prolonged crisis. Consider allocating 5–10% to GLD (Overseas) or KODEX Gold Futures (Domestic).
Regularly — Monitoring Hormuz situation + Rebalancing
The key variable in this crisis is whether the Strait of Hormuz opens. If the strait opens, oil prices and market instability could stabilize in the short term, providing an opportune time to reduce exposure to defense and energy sectors while increasing holdings in growth stocks. Please set up alerts on TradingView for Brent crude (monitor if it stabilizes below $114) and the VIX (close hedges if it returns below 20).
Conclusion — It is not courage, but preparation that overcomes fear.
Trump's ultimatum, Iran's retaliation, the blockade of the Strait of Hormuz, oil prices surpassing $100—this moment is certainly frightening. However, the data speaks clearly. Panic selling is a statistically inferior strategy , and trusting a prepared portfolio and holding on is superior in the long run.
Of course, we must also keep open the possibility that “this time could really be different.” That is why we increase hedge weighting, diversify risk into energy, defense, and gold, and monitor the VIX and the situation in Hormuz. For a prepared investor, a crisis is a risk, but at the same time, it is also an opportunity to secure a better position .
This crisis will end. History proves it. Review your portfolio now so that you can be in a good position when that day comes.
All figures and analyses in this article are for informational purposes only and do not constitute investment advice . Monte Carlo simulations are statistical estimates based on historical data and do not guarantee actual returns. Geopolitical events are unpredictable, and historical patterns do not necessarily repeat themselves. All investment decisions and responsibilities rest with the individual, and consulting with a professional financial advisor before making important decisions is recommended.
📌 Was this analysis helpful?
In the next post, we plan to cover “Prolonged Hormuz Crisis Scenario — What Happens to My Portfolio If Oil Prices Reach $150?”
If you are curious about your current portfolio's exposure to geopolitical risk, please leave a comment. We will analyze it together.
How this content was produced
Aleph's research AI agent assisted with collecting and analyzing public data, creating charts and visuals, and structuring the draft. Davar personally reviewed and edited the sources, figures, reasoning, and final conclusions.
This content is for informational purposes only and is not personalized investment advice or an individual stock recommendation. Read the full disclaimer

Davar
Davar builds and operates Aleph's research AI agent and writes and reviews analysis on macroeconomic developments and AI industry trends.
© Aleph. All rights reserved.