
Why Gold Prices Fall During War — The Meaning of $4,700 Based on 10,000 Simulations
The price of gold rises when war breaks out—that is what we learned in textbooks. However, as the crisis of a war between the U.S. and Iran intensifies, the price of gold has actually plummeted by 6% to $4,700. It is reasonable to feel that something is amiss. This article summarizes the reasons behind this paradox and how to approach the situation using data.
1Current Situation — First, the current state
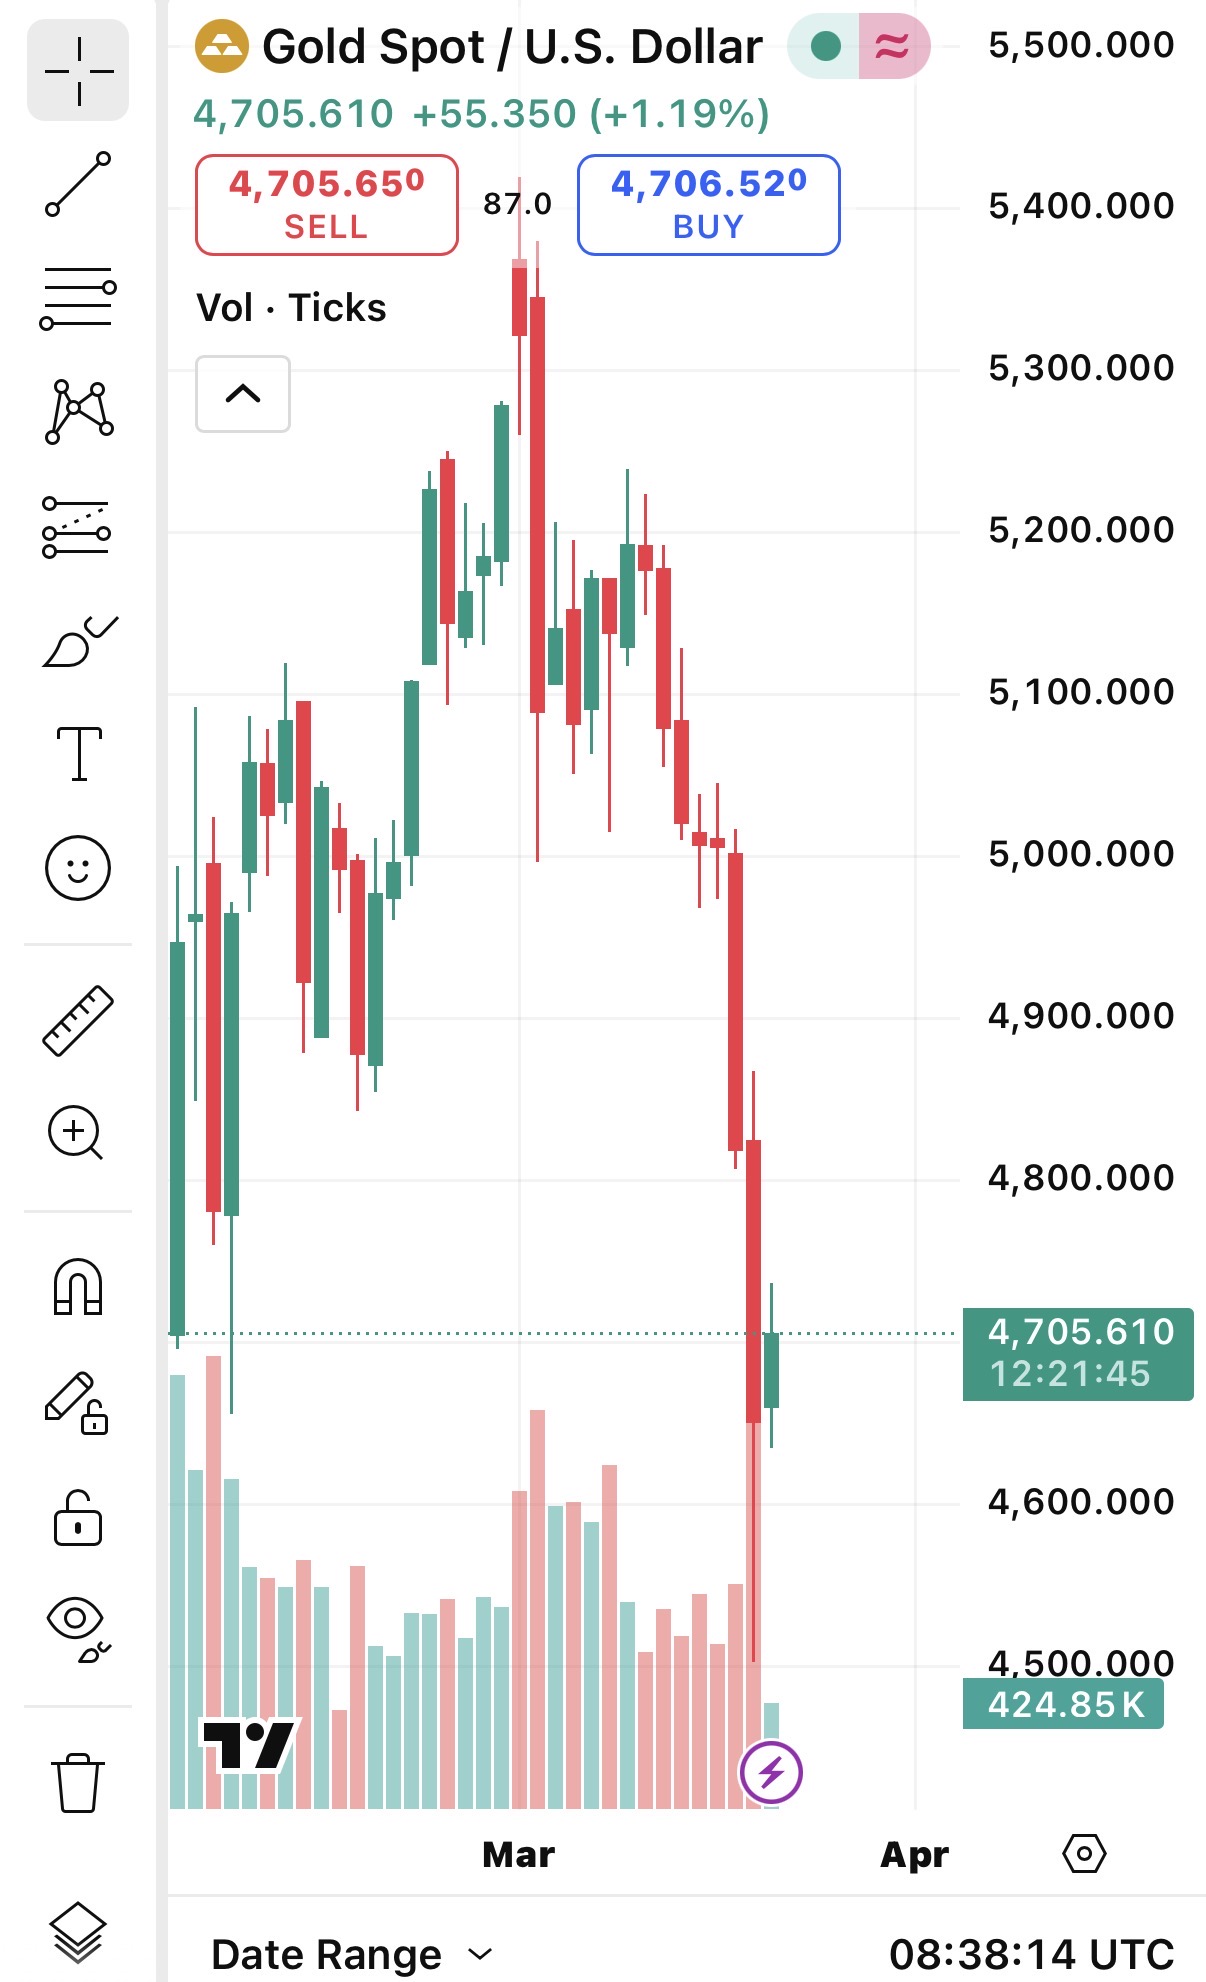
The psychological support level of $5,000 collapsed , and the market plunged about 6% in just two days, falling to the $4,700 mark . This decline is a paradoxical phenomenon caused not by "gold being weak," but by "the market being too scared." It is more accurate to view this as a phase of overheating resolution created by the record-breaking bull market that continued throughout 2025.
These figures do not indicate the scale of the decline. The same thing happened during the 2008 financial crisis and the early stages of the 2020 pandemic. And each time, gold hit an all-time high following the crash.
2 The Reason Gold Prices Fall During War
It is true that gold is a safe haven asset. However, when the market is gripped by extreme fear, even safe haven assets are sold. Three channels are currently operating simultaneously.
In the early stages of a crisis, the demand for cash overwhelms all assets.
When margin calls (forced liquidation warnings) flood stock and cryptocurrency accounts, investors sell gold to generate cash. This is not because they dislike gold, but because it sells the fastest. The exact same thing happened in 2008. We are currently witnessing the paradox where gold sells as the fear index ( VIX ) soars.
$5,000 collapse → Automated sell and stop-loss orders overlapped
$5,000 is not just a number. It is the threshold where algorithmic selling triggers are set for hedge funds worldwide. As this line was breached, it is highly likely that algorithmic selling and stop-loss orders overlapped. With profit-taking volumes also compounding the situation, a chain of selling occurred where one decline begat another.
The dollar has emerged as a competitor to gold.
As geopolitical crises intensify, capital flees to two places— gold and the dollar. Currently, the shift toward the dollar is overwhelming. Since the surge in the Dollar Index (DXY) is inversely correlated with the price of gold, gold is suppressed as the dollar strengthens. I have separately summarized the structure of how the war with Iran affects energy prices and the dollar .

3 What is the price of gold in 1 month? — 10,000 Monte Carlo simulations
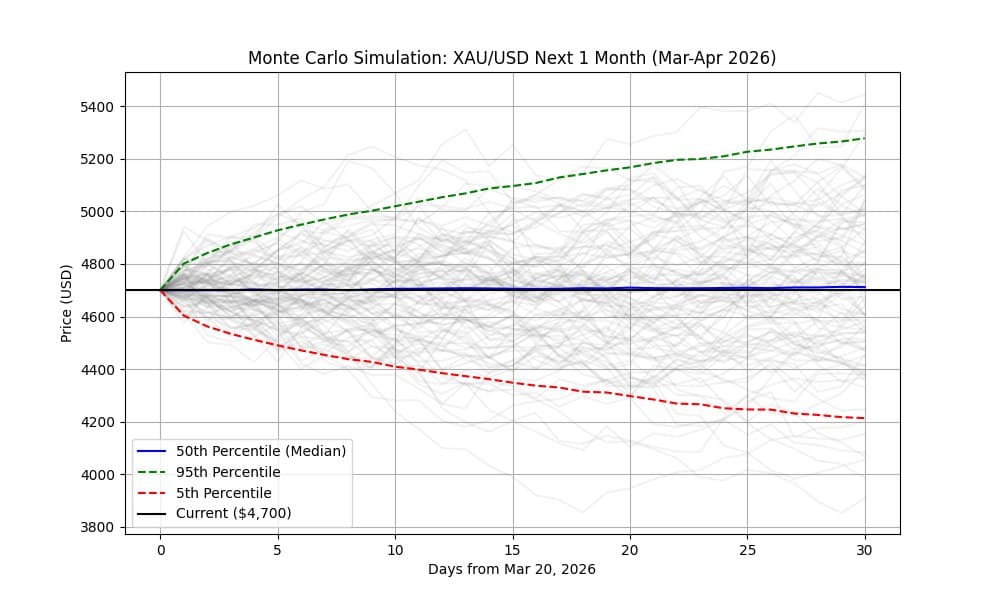
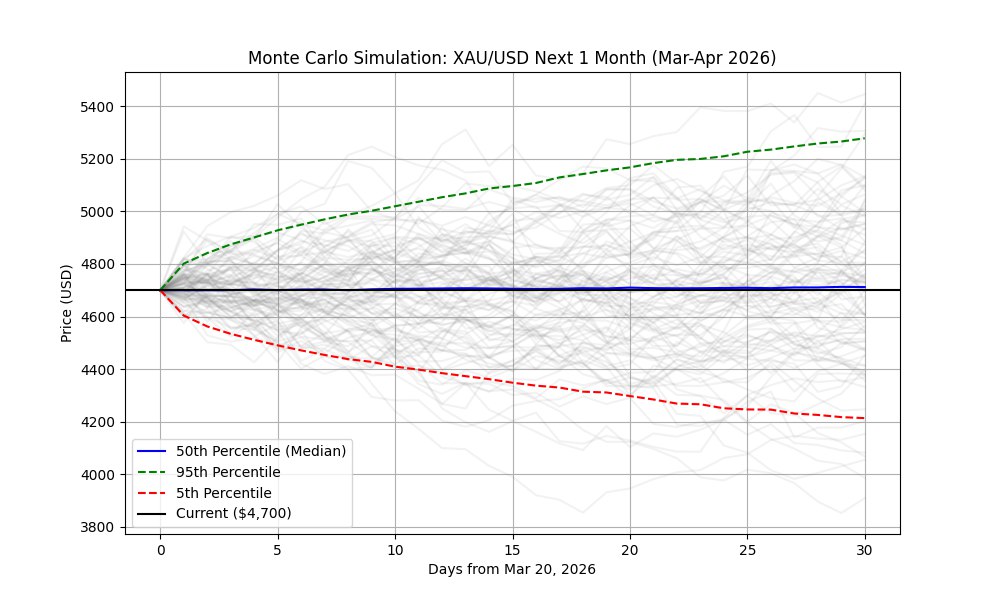
It is not a prediction, but a probability distribution . No one can definitively conclude that “the price of gold will rise in the future.” Simulation is not a tool for picking the right direction, but a tool for viewing the range of possible paths. This is the result of 10,000 simulations over 30 days, starting from the current price of $4,700.
📋 Expected results for 3 scenarios
| scenario | Probability | Gold price after 1 month | condition | react |
|---|---|---|---|---|
| V-shaped rebound (optimism) | Top 5% | $5,278 | Middle East Negotiations Concluded + Dollar Turns Weaker | Observation section |
| Maintain range (neutral) | median | $4,712 | Lull in Geopolitical Tensions + Continued Dollar Strength | Maintain cash weight, wait and see |
| Further plunge (pessimism) | bottom 5% | $4,213 | Hormuz Blockade + Continued Dollar Panic Buying | Position review period |
※ The simulation results are statistical probability distributions based on a Python Monte Carlo Engine (10,000 iterations) and do not constitute an investment recommendation.
This means that out of 10,000 simulations, half are higher and half are lower. The signal from the market is that "a trend of neither rising nor falling significantly from the current level is the most likely." However, the upper and lower tails (5th / 95th) could materialize at any time—because the market always reacts to extremes based on a single geopolitical variable.
4 How to Approach Now — Judgment Criteria by Section
There is a section suggested by the simulation. You just need to remember the three baselines.
🔍 Observation Range — $4,400 ~ $4,500
It falls within the bottom 10% range in simulations. As it may overlap with the technical oversold state based on RSI, it is a range worth considering for long-term investors . The basic principle for this zone is to approach it in installments rather than investing all at once.
📈 Rebound Confirmation Zone — $5,100 / $5,300
Confirming a breakout above $5,000 is the criterion for increasing the reliability of a rebound. $5,100 is a technical resistance level, and $5,300 is the upper limit of the simulated 95th percentile—the flow in this zone is effective for gauging the mid-term direction.
⚠️ Risk Zone — $4,200 or less
If the simulation bottom 5% line at $4,213 is breached, it becomes more likely to be a trend reversal rather than a simple correction. If it drops to this level, it means it is time to re-evaluate the size of your positions. Thinking "it will eventually go up" is the most dangerous mindset in a volatile market like the present.
The simplest way to invest in gold domestically is through gold ETFs (KODEX Gold Futures, ACE KRX Gold Spot) . You can trade directly from your securities account without the costs of storing physical gold or paying spreads. However, since exchange rate risk (KRW/USD) moves in tandem, gold ETFs can benefit doubly when the dollar is strong. Currently, in the KRW/USD range above 1,500 KRW, a combination of
금 ETF + 달러 ETF acts as a double hedge. 
5The same thing happened every time
Before you panic, you just need to look back at the same situation twice.
| period | case | Gold price drop | cause | Subsequent results |
|---|---|---|---|---|
| September 2008 | Lehman Brothers crisis | ▼ Approximately 30% | Liquidity crisis → Selling gold | Doubled over the following two years |
| March 2020 | Early stages of the pandemic | ▼ Approximately 12% | Margin call → Secure cash | All-time high after 6 months |
| March 2026 | US-Iran War | ▼ Approximately 6% | Dollar bias + algorithmic selling | Simulation: Maintain median $4,712 |
In both instances, the magnitude of the decline differed, but the structure was the same—fear of liquidity led to the sale of gold first, and funds returned to gold after the securing of cash was completed. There is currently no basis to view this time as different from those two cases. The reason for looking to history during panic periods is also in the same context.
The plunge in gold prices caused by the liquidity crisis was temporary. However, "temporary" could last a week or three months. Without a cash reserve and a split strategy to weather that period, one will end up repeating a pattern of selling at the lows and buying at the highs. If you set the area around $4,200 as the threshold for the risk zone, judgment becomes simple above that level.
Conclusion — $4,700 Gold, Crisis or Opportunity?
It is a paradox that the price of gold falls during wartime, but the same thing happened in 2008 and 2020. Gold is temporarily sold when liquidity fears, algorithmic selling, and a strong dollar overlap. Once the war for cash subsides, gold always returns as a hedge asset.
10,000 simulations reveal one thing: the current level of $4,700 is not the “beginning of a massive crash,” but rather the “midpoint of a volatility zone.” The $4,400–$4,500 range is an observation zone worth watching for long-term investors, while the level below $4,200 is a risk zone where a trend reversal must be confirmed. Breaking through $5,100 serves as a benchmark to verify the reliability of a rebound. Using these three zones as references is the practical help that the simulation can provide at this point.
To be honest, it is difficult to be certain in a zone like this. Personally, I believe a baseline is more useful than certainty. At least for now, it is better to center your view around the $4,200 baseline.
All content in this article is for reference purposes only, based on data analysis using a Python Monte Carlo Engine (10,000 iterations), and does not constitute investment advice. The investor bears the ultimate responsibility for all investment decisions.
📌 Was this analysis helpful?
In the next post, we plan to cover “How Long Will the Dollar Be Strong? — DXY Outlook and Signals of a Gold Rebound.”
How this content was produced
Aleph's research AI agent assisted with collecting and analyzing public data, creating charts and visuals, and structuring the draft. Davar personally reviewed and edited the sources, figures, reasoning, and final conclusions.
This content is for informational purposes only and is not personalized investment advice or an individual stock recommendation. Read the full disclaimer

Davar
Davar builds and operates Aleph's research AI agent and writes and reviews analysis on macroeconomic developments and AI industry trends.
© Aleph. All rights reserved.