
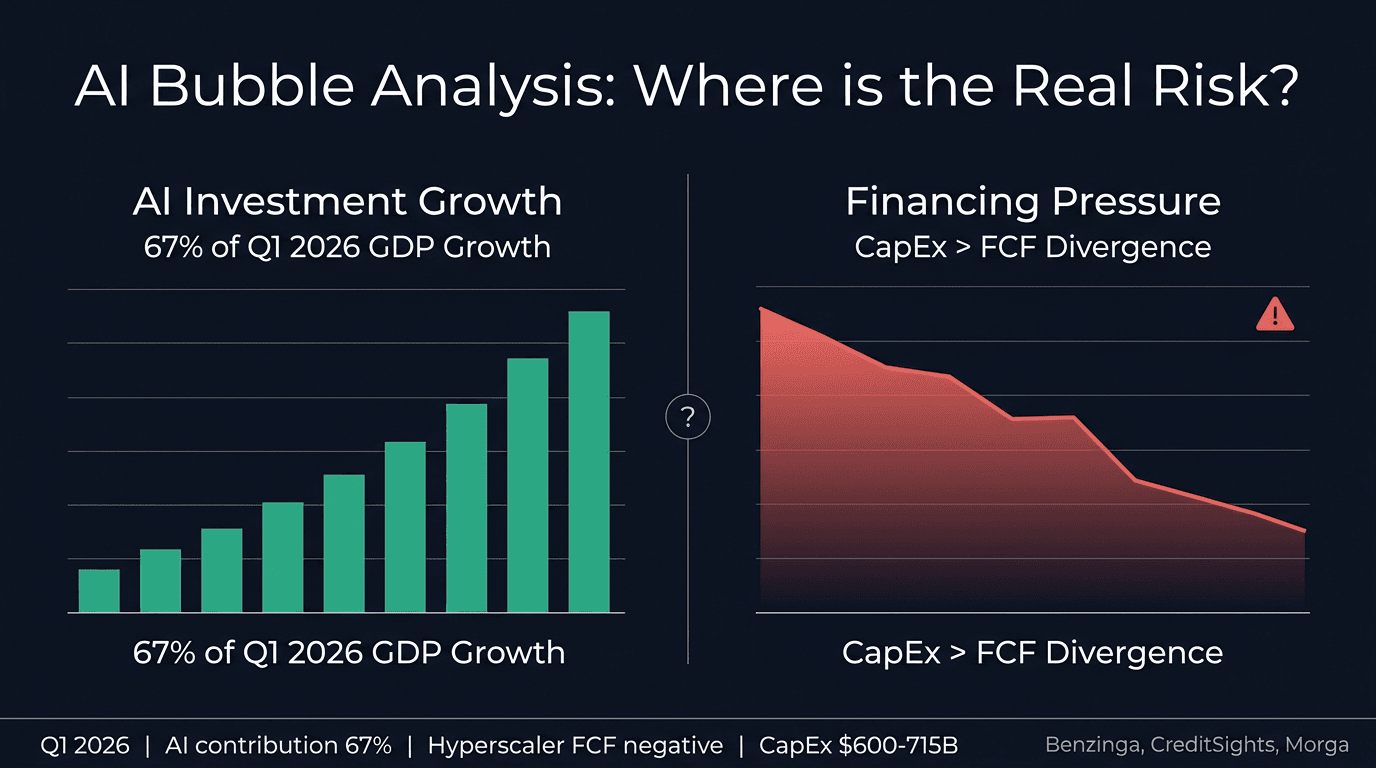
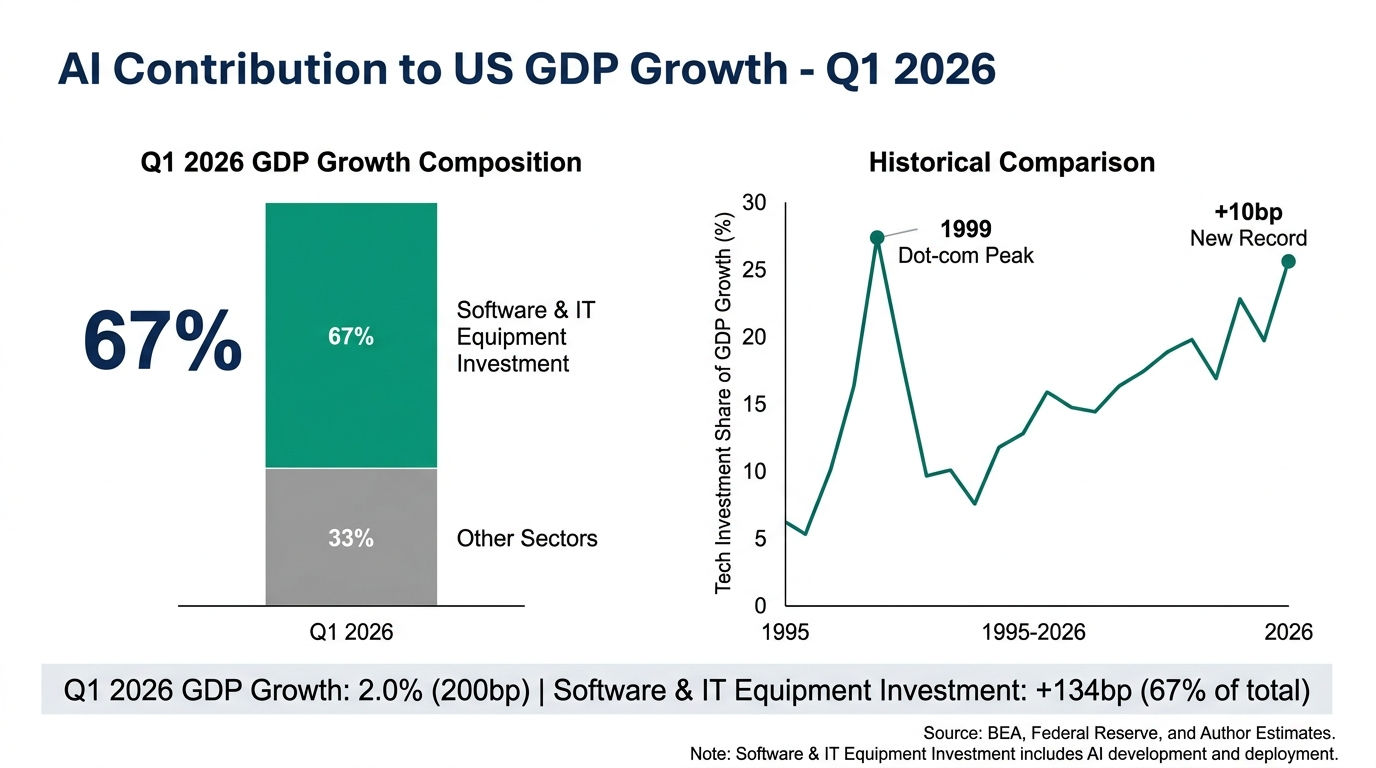
To start with the conclusion: AI is not a bubble. More precisely, while the demand itself is not a bubble, the financing structure is closer to one. Data shows that AI and technology investment accounted for 67% of U.S. GDP growth in Q1 2026. This marks the highest technology contribution in history, surpassing the 1999 dot-com bubble record by just 10 basis points. However, while this figure appears to be a strength, it implies that "without AI investment, the U.S. economy would have experienced virtually zero growth." The U.S. economy's dependence on AI has itself become a new risk. In this article, moving beyond the dichotomy of whether it is a bubble or not, we will organize the layers of analysis to determine where the bubble exists and where it does not, and if it were to collapse, where it would start and how far it would spread. We will also examine how a potential U.S.-Iran war could stimulate this very structure.
1Q1 2026 Shocking Data — What the Numbers Tell Us
The preliminary U.S. Q1 GDP figure, announced on April 30, 2026, was 2.0% (annualized). On the surface, this is a healthy figure. However, a closer look reveals a different story. Investment in software and IT equipment contributed 134 basis points (bp) in a single category. This accounts for 67% of the total growth of 200 bp (Benzinga, Bespoke Investment Group). Some views place the figure at 75% depending on the calculation range (CryptoBriefing, Global Economic). While the calculation methods differ, the direction is the same.
The Kobeissi Letter shared this data and summarized it as follows: "Without this AI-driven tech investment, Q1 GDP growth would have been close to flat." Excluding AI investment, U.S. economic growth is virtually zero. The U.S. consumer savings rate in Q1 stood at 3.6%, the lowest level since November 2025. The structure is one where AI investment is propping up the economy while the consumption base weakens. Barclays summarized this situation in a single sentence: "As goes AI, so goes the economy."
To summarize the meaning of this data in one sentence: AI has become the engine of the U.S. economy, but that engine is not yet able to generate its own fuel. We are in a phase where investment is explosive, but monetization is failing to keep pace.
Is 2a Bubble? — We Must Distinguish Between the Two Levels
Answering the question of whether it is a bubble with a simple "Yes" or "No" is the wrong approach. This is because the levels are different. A proper answer can only be obtained by dividing the AI ecosystem into two levels.
| Layer | Whether it is a bubble | reason |
|---|---|---|
| Demand and infrastructure layers Google Cloud, AWS, Azure, NVIDIA, SK Hynix | Not a bubble | Google Cloud +63% YoY, AWS +28%, Azure +40% (Q1 2026). Gemini processes 16 billion tokens per minute. 330 enterprise customers consume over 1 trillion tokens. Demand is real. |
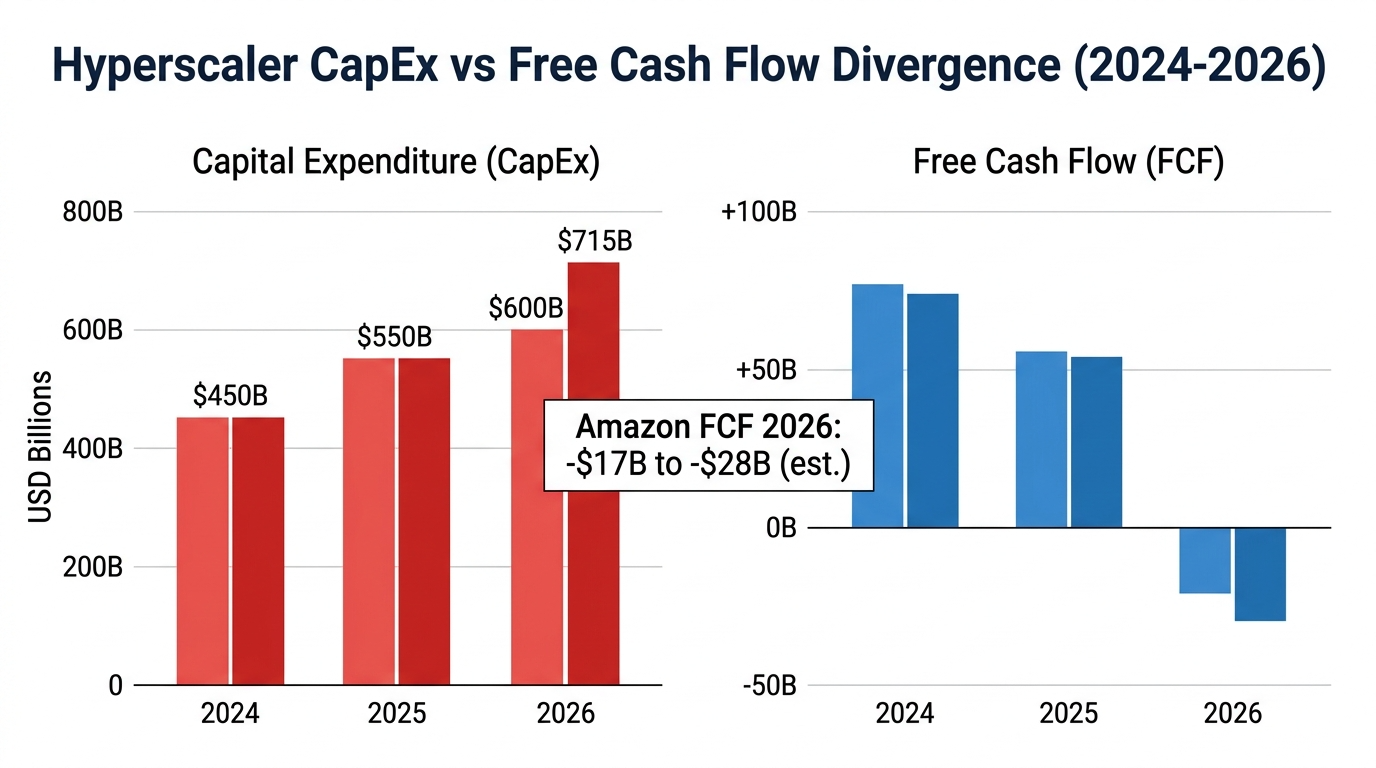
| Financing and Valuation Layers AI applications such as OpenAI and Anthropic | High possibility of a bubble | OpenAI PSR 65x. Hyperscaler FCF inversion (Amazon -$17–28B, Alphabet -90%, MS -28%). CapEx financing via debt ($108B in 2025). Circular credit structure. |
The most critical risk is the circular credit structure . Hyperscalers lend computing credits to OpenAI and Anthropic, allowing them to use those credits to purchase the hyperscalers' computing power. Ross Hendricks described this structure as follows: "OpenAI and Anthropic account for about 50% of the cloud backlogs of Microsoft and Amazon. It is a cyclical structure where hyperscalers lend money to AI startups to purchase their own computing power." The moment this cycle breaks—the moment AI startups fail to repay the credits—the hyperscalers' CapEx guidance plummets across the board. This triggers a chain reaction leading to adjustments in demand for semiconductors and memory.
3 1999 Dot-com Bubble vs. 2026 AI — 2 Similarities, 3 Differences
This question is key to investment decisions. If they are the same, you should avoid them; if they are different, there is an opportunity. Be honest and look at both sides.
| item | 1999 Dot-com Bubble | AI in 2026 | verdict |
|---|---|---|---|
| actual demand | There was no traffic. There were users, but they did not pay. | Traffic is real. Google Cloud grows 63%, and enterprise customers actually spend tokens and pay costs. | ✅ Difference |
| Corporate profits | Most of the M7 companies are operating at a loss. No revenue model. | M7 net profit growth rate 34% in 2023, 36% in 2024, 21% forecast for 2025. Supported by performance (Munhwa Ilbo). | ✅ Difference |
| Infrastructure practicality | Fiber optic cables were over-installed but eventually became the backbone of the internet. | AI data centers, GPUs, and HBM are already in excess demand. HBM is sold out. "Supply constraints, not demand constraints" (Common statement by hyperscalers). | ✅ Difference |
| CapEx vs. Monetization Speed | Investment far outpaced returns. Most dot-com companies went public without making a profit. | 2026 CapEx $600–715B vs. AI revenue approximately $25B (based on 2025 figures). A phase where the pace of monetization fails to keep up with the pace of investment. | ⚠️ Similar |
| Financing structure | VC overinvestment. Concentration of funds on unprofitable companies. | Hyperscaler FCF inversion, debt financing ($108B in 2025), circular credit structure. The financing method raises questions about sustainability. | ⚠️ Similar |
Conclusion: The demand and performance bases are different from 1999. However, the financing structure and the speed of monetization resemble those of 1999. This bubble is a financing bubble, not a demand bubble. The reason this difference is significant is that while a demand bubble collapses as a whole, a financing bubble delivers differentiated shocks to different layers.
4If It Explodes, Where Does It Spread From? — Layer-by-Layer Scenarios
When a financing bubble undergoes a correction, the shock spreads sequentially from top to bottom. The 2001 dot-com crash followed this exact path. It started with .com applications and spread to infrastructure companies like Cisco and Lucent, with Cisco falling by nearly 80%. Infrastructure is not safe; however, it falls later and less severely.
| Layer | Adjustment scenario | trigger | Possibility of recovery |
|---|---|---|---|
| AI applications Private AI such as OpenAI and Anthropic | 60~80% valuation correction possible. Leading the pack and falling the most. | Monetization failure, hyperscaler credit recovery, reversal in investor sentiment | Low — Partial survival, majority cleanup |
| Cloud and Hyperscaler AWS, Azure, Google Cloud | 30~50% correction. CapEx guidance cut hits stock price hard. | AI Startup Monetization Failure → Credit Default → CapEx Cut | Intermediate — Recovery possible with actual profit |
| Semiconductor and hardware NVIDIA, SK Hynix, TSMC | 20–40% adjustment. Triggered by demand revision. However, rapid recovery due to actual demand. | Hyperscaler CapEx Cut → Decrease in GPU and HBM Orders | High — Fast recovery based on actual demand |
| Energy, power, and cooling infrastructure Data center REITs, power companies | Most defensive. Based on real assets. Relative stability even when AI investment slows. | Limiting short-term shocks through long-term contract structure | highest |
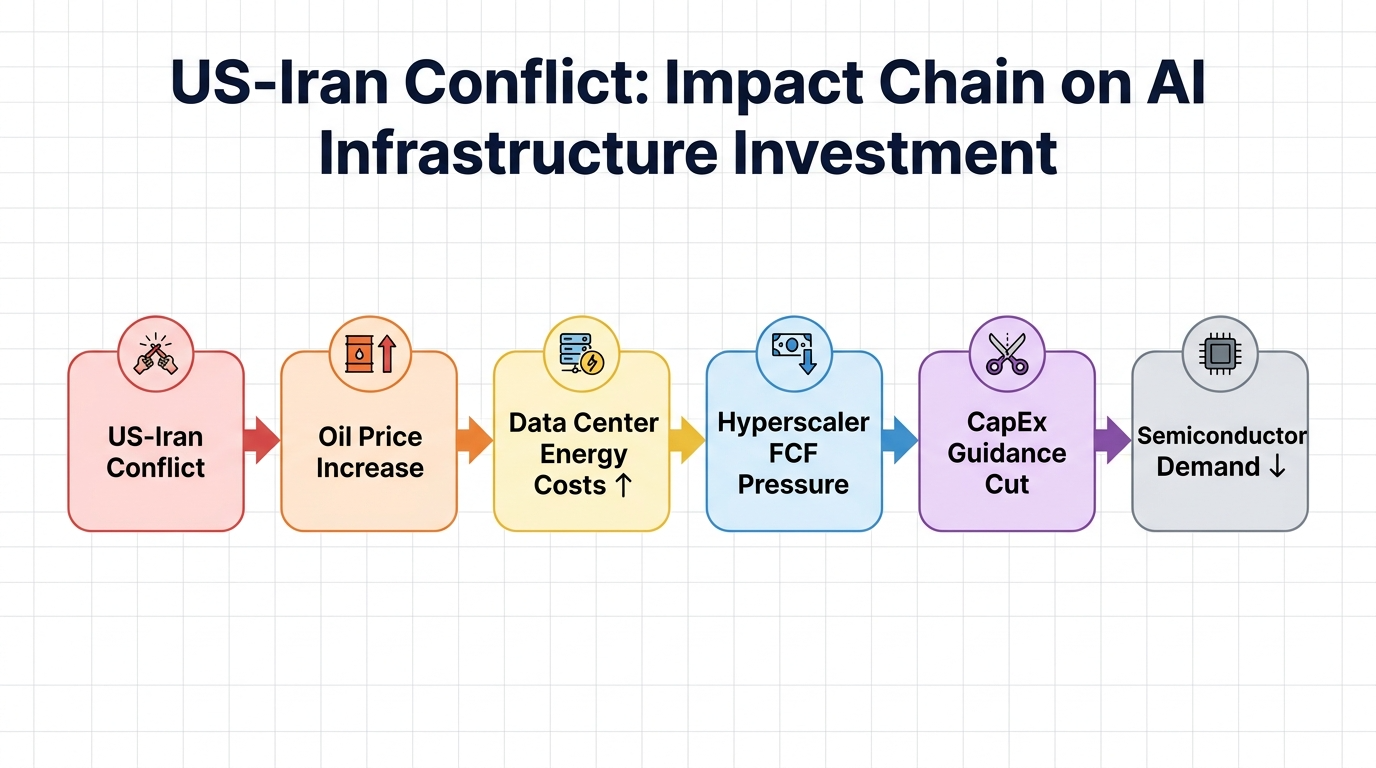
The core of the transition mechanism is the CapEx guidance cut. The moment even one hyperscaler drastically reduces its CapEx guidance, market sentiment reacts in a chain reaction. NVIDIA orders fall, the demand outlook for SK Hynix HBM declines, and concerns spread to TSMC's advanced process utilization rates. It takes 6 to 18 months for this chain reaction to actually take effect. It is highly likely to follow a path of gradual adjustment rather than an immediate collapse.
5 US-Iran War — External Shocks Stimulating a Bubble
This financing structure is being subjected to an external shock. It is a U.S.-Iran war. There are three paths to this shock.
First is the energy cost channel . Data center electricity costs have risen due to rising oil prices. If additional cost pressure accumulates for hyperscalers that already have negative FCF, they are forced to cut their CapEx guidance first. TIME pointed out, "Investment in AI infrastructure is effectively propping up the U.S. economy" —while this is a strength, it is also a structural vulnerability where the entire economy is shaken if AI investment retreats.
Second is the interest rate channel . The OECD forecasts U.S. inflation at 4.2% in 2026. Goldman Sachs raised its probability of a recession over the next 12 months to 30%. If energy shocks drive up inflation, it will be difficult for the Fed to lower interest rates. For hyperscalers that finance CapEx through debt, prolonged high interest rates are a direct blow. They borrowed $108 billion in 2025 alone, and a total of $1.5 trillion in debt is expected to be issued in the future.
Third is the supply chain channel . Production disruptions in Qatar have reduced the global helium supply by approximately one-third. Helium is an irreplaceable material in the semiconductor manufacturing process. Rising semiconductor costs are impacting HBM supply costs. Oxford Economics warned that if the war is prolonged, global GDP could fall by as much as 1.4%. The United States is also not immune to the scenario of entering a recession.
6So What Should Be Done — Practical Decision Checklist
When applying this analysis to investment decisions, the approach varies by layer. The way to avoid bubbles without sacrificing growth is to select the right layer.
AI Application Layer — Stay Away for Now
With OpenAI at a PSR of 65x, it takes 2 to 3 years for unlisted AI startups to realize monetization to justify their valuations. A war between the U.S. and Iran could accelerate that process. It is also advisable to keep exposure low to listed AI application companies until clear evidence of monetization emerges, as they represent the first layer where the financing bubble is likely to burst.
Semiconductor and Hardware Layers — Partitioned Access, Trigger Verification
NVIDIA, SK Hynix, and TSMC are based on actual demand. They are layers that recover quickly even if a correction occurs. However, since hyperscaler CapEx guidance cuts can act as a trigger, I do not invest all at once. There are three variables to check: whether hyperscalers maintain their quarterly CapEx guidance, actual NVIDIA GB300 shipment data, and the timing of the HBM4 transition. The principle is to enter in 3 to 4 staggered trades whenever these three factors confirm the direction.
Energy, Power, and Cooling Infrastructure — A Paradoxically Strengthening Layer
As the energy dependency of AI infrastructure becomes more prominent amidst the U.S.-Iran war, the scarcity of power and cooling infrastructure increases. Data center REITs, power companies, and cooling technology firms hedge against short-term shocks through long-term contract structures while absorbing the growth in AI demand over the long term. Morgan Stanley also specified infrastructure and REITs as defensive alternatives following the Iran war. This is a strategy of investing in AI but shifting the focus from hardware to infrastructure.
7Frequently Asked Questions
| question | answer |
|---|---|
| Is 67% of GDP evidence of a bubble or evidence of growth? | It is both. It is evidence of growth in that AI investment is actually propping up the U.S. economy. At the same time, it is also evidence of dependency risk in that without AI investment, economic growth would be nearly zero. The difference from 1999 is that there is real demand, and the similarity is that investment moves much faster than monetization. |
| Why is the stock price holding up when the hyperscaler's FCF is negative? | This is because the market views it as "buying a future monopoly structure at a loss now." Goldman Sachs analyzed that the supply bottleneck stems from supply constraints, not demand. The problem is that for this thesis to be correct, noticeable AI monetization must emerge by 2026–2027. If such evidence does not appear, a revaluation is imminent. |
| Could a US-Iran war end the AI investment cycle? | It is highly unlikely that it will end. TIME suggested that as AI moves into the "essentials" realm, even war may not be able to halt investment. However, energy shocks, a worsening interest rate environment, and rising debt costs could slow down the pace of CapEx for hyperscalers. A slowdown in speed, rather than the end of the cycle, is a more realistic scenario. |
| Should Korean investors pull out of AI now? | No. The layers must be changed. The direction is to reduce the valuation of AI applications, maintain the semiconductor and hardware divisions through a spin-off, and increase the weight of the energy and infrastructure layers. Amidst the US-Iran war, SK Hynix and Samsung Electronics benefit from increased demand for HBM while simultaneously facing pressure from rising helium costs. While price passing is possible as long as the supplier-dominated structure is maintained, one must keep a close watch for signs that this structure is breaking down. |
| Could a recession in the U.S. be coming now? | Goldman Sachs raised the probability of a recession over the next 12 months to 30%. Oxford Economics warned that global GDP could fall to 1.4% if the war is prolonged. It is more accurate to say that "the probability of a recession has risen significantly" rather than "a recession is coming." With the consumer savings rate at 3.6%, buffering capacity has also diminished, leaving the economy vulnerable to external shocks. |
Conclusion — Demand is real. Financing is weak. Choose a layer.
The figure of AI contributing 67% to GDP speaks to two facts simultaneously: the demand for AI is real, and the U.S. economy is dangerously dependent on that demand. The difference from the 1999 dot-com bubble is that traffic is coming, corporate profits are real, and infrastructure demand exceeds supply. However, there are also similarities. CapEx is far ahead of monetization, and the financing structure relies on circulating debt.
The issue of 'concentration' that we have been discussing throughout this series is also confirmed in macroeconomic data. Institutional funds are concentrated 65% in four companies, retail funds in DRAM ETFs, and now U.S. economic growth itself is 67% concentrated in AI investment. The structure consistently points in the same direction. However, the fact that the direction is correct does not make this structure safe.
There is only one conclusion from an investment perspective: instead of focusing on AI, you must select a specific layer. Reduce applications, maintain semiconductors and hardware through a spin-off, and increase the weight of energy, power, and cooling infrastructure. Being in the layer that will be hit the latest and least when the financing bubble bursts is the correct way to invest in AI in this market right now.
All content in this article is for informational purposes only and does not constitute investment advice. The figures presented are estimates from various sources and may differ from reality. Geopolitical situations and macroeconomic data are subject to rapid change. All investments carry the risk of principal loss, and you bear all responsibility for your investment decisions. We recommend consulting with a professional financial advisor before making any important decisions.
📌 Was this analysis helpful?
This article is the final part of a three-part series. Reading Part 1: AI Investment Has Entered Maturity and Part 2: DRAM ETF Concentration Risk together will complete the full picture.
In the next post, we plan to cover "Things You Can Actually Buy in the AI Infrastructure Layer — Power, Cooling, and Data Center Investment Guide."
Subscribe and get notifications →How this content was produced
Aleph's research AI agent assisted with collecting and analyzing public data, creating charts and visuals, and structuring the draft. Davar personally reviewed and edited the sources, figures, reasoning, and final conclusions.
This content is for informational purposes only and is not personalized investment advice or an individual stock recommendation. Read the full disclaimer

Davar
Davar builds and operates Aleph's research AI agent and writes and reviews analysis on macroeconomic developments and AI industry trends.

© Aleph. All rights reserved.