
A week ago, Aleph set the split buying range for gold at $4,400–$4,500 . Today, the price of gold is $4,492 . Exactly in the middle of that range. We will explain why gold is falling despite the outbreak of war, and why now is the buying timing, through the geopolitics of Kharg Island, a psychological analysis of Trump's 'imperial management,' and three Monte Carlo simulations using different methodologies.
In "Analysis of Gold Crash to $4,700 — 10,000 Monte Carlo Simulations," published on March 20, Aleph projected the following: Split buying zone at $4,400–$4,500 / Median value after one month at $4,712 / Reduce position if stop-loss line of $4,200 is breached . As of the closing price on March 27, the price of gold was $4,492.5 — it had entered the buying zone precisely. This article is a follow-up analysis to that.
13-Line Summary — What is happening right now
Plunging 19.7% in just one month from an all-time high, it presents a paradoxical situation where safe haven assets are actually falling despite the outbreak of war. However, the 200-day moving average is still holding, and JPMorgan maintains its year-end target of $6,300.
2“Why is gold falling when it’s a war?” — 4 Mechanisms
“Gold is falling because of war. Not despite war.” This is the headline of an analysis by Investing.com on March 23. It is counterintuitive, but it is clear if you follow the logic.
Mechanism ① Oil price → Inflation → Interest rate → Gold price decline
The economic core of this war is the skyrocketing oil prices . Dubai oil prices have hit an all-time high of $170, while traffic in the Strait of Hormuz has dropped by 95%. When oil prices rise, inflation expectations increase, and when inflation rises, the Fed cannot lower interest rates. When interest rates are high, the attractiveness of gold, which does not pay interest, decreases. War → Oil Prices ↑ → Inflation ↑ → Inability to Lower Interest Rates → Opportunity Cost of Holding Gold ↑ → Sell Gold . To summarize in a single line, it is like this.
Mechanism ② Dollar Strength
If war breaks out, the entire world hoards dollars. Global risk aversion → skyrocketing demand for dollars → rise in the DXY (Dollar Index). Since gold is traded in dollars, when the dollar becomes expensive, the price of gold relatively decreases.
Mechanism ③ Margin Call Forced Selling
As gold fell below $5,000, leveraged positions faced margin calls. This created a vicious cycle where forced liquidations triggered further declines. $2.91 billion flowed out of the GLD ETF in a single day—the highest amount since 2016 (Investing.com, March 4). This was not because investors “wanted to sell gold,” but because they “cashed out” profitable gold to cover losses elsewhere.
Mechanism ④ Defense of Real Interest Rates
If the Fed fails to cut interest rates, real interest rates (nominal rate – inflation) will not fall. Gold is an asset that shines when real interest rates drop, but that momentum has vanished. Even ECB President Christine Lagarde has stated that "interest rate hikes are possible at any meeting" (Reuters, March 25).
The drop in gold does not mean it has failed as a safe haven asset. The war raised oil prices, oil prices raised inflation, and inflation kept interest rates low, causing the opportunity cost of gold to rise . If you understand the mechanism, you can determine whether this is temporary or structural.
3 Harg Island — The Key Variable of the War No One Talks About
This section is the most important part of this article. It offers insights rarely covered in market analyses.
Kharg Island is a small island located 26 kilometers off the coast of Iran. However, this single island handles 90% of Iran's crude oil exports (Reuters, CNN). With a daily loading capacity of 1.3 to 1.6 million barrels and a storage capacity of 30 million barrels, it is the heart of the Iranian economy.
On March 14, U.S. forces struck military targets on Kharg Island. President Trump stated on social media that all military targets on Kharg had been completely destroyed and warned that oil infrastructure could also be struck if Iran continued to disrupt the Strait of Hormuz (Reuters, 3.14).
Dan Pickering, CIO of Pickering Energy Partners, states: “Removing the Hårg infrastructure will permanently eliminate 2 million barrels a day from the market—not until the Strait issue is resolved, but permanently.”
Harg Island Scenario — Arguments for and against
| Arguments in favor of occupying/destroying Harg | Counterargument (Risk) |
|---|---|
| Blocking Iran's key revenue sources → Pressure for surrender | IRGC Anti-ship Missile (Noor, Ghader) Defense Breakthrough Difficulty |
| Trump's biggest bargaining chip | Attack on another country's territory → Issues in UN resolutions and international law |
| 1980 Iran-Iraq War precedent | Strengthening the justification for China and Russia's intervention |
| Iran's foreign currency revenue is effectively blocked | Brent $150+ Global Shock → US Domestic Economy Also Hit |
| Possibility of an early end to the war | Iran’s “becoming more aggressive when cornered” reaction pattern |
Kharg Island is the switch for war. If oil infrastructure is actually struck, oil prices will skyrocket to over $200, and global stagflation will become a reality. Conversely, if the threat of Kharg forces Iran to the negotiating table, a scenario opens up where the war ends, oil prices plummet, and gold rebounds. Either way, gold will regain its role as a "safe haven asset."
4 Pullback or Trend Reversal? — Battle over the 200-day moving average
To start with the conclusion: This is a pullback. It is not a trend reversal. I will demonstrate the basis for this using technical analysis and JP Morgan data.
| Price level | meaning | Current status |
|---|---|---|
| $5,595 | All-time high (1.29) | -19.7% decline |
| $5,000 | psychological resistance line | Transition to resistance after collapse |
| $4,492 | Current price (3.27) | The exact center of the split buying zone |
| $4,200 | 200-day moving average + structural support | Last line of defense (stop-loss criteria) |
| $3,873 | Pivot point | Trend reversal confirmed upon breakout |
JPMorgan maintains its year-end 2026 gold price target at $6,300/oz (updated on February 25). The average Q4 forecast is $5,055/oz. Basis for this forecast: expected central bank purchases of approximately 755 tons/year, the de-dollarization trend (global central bank gold holdings rising from ~15% to ~20%), and the possibility of breaking the $6,000+ mark even if only 0.5% of foreign investors' U.S. asset holdings shift to gold (FXStreet).
As summarized in the previous analysis , gold rebounded by 28% within six months after plunging 34% during the 2008 Lehman Brothers crisis, and reached an all-time high within five months after plunging 14% at the beginning of the 2020 pandemic. The selling of gold at the start of a liquidity crisis is a historically recurring pattern, and it has recovered every time.
5 Aleph Monte Carlo Simulation — 3 models reached the same conclusion
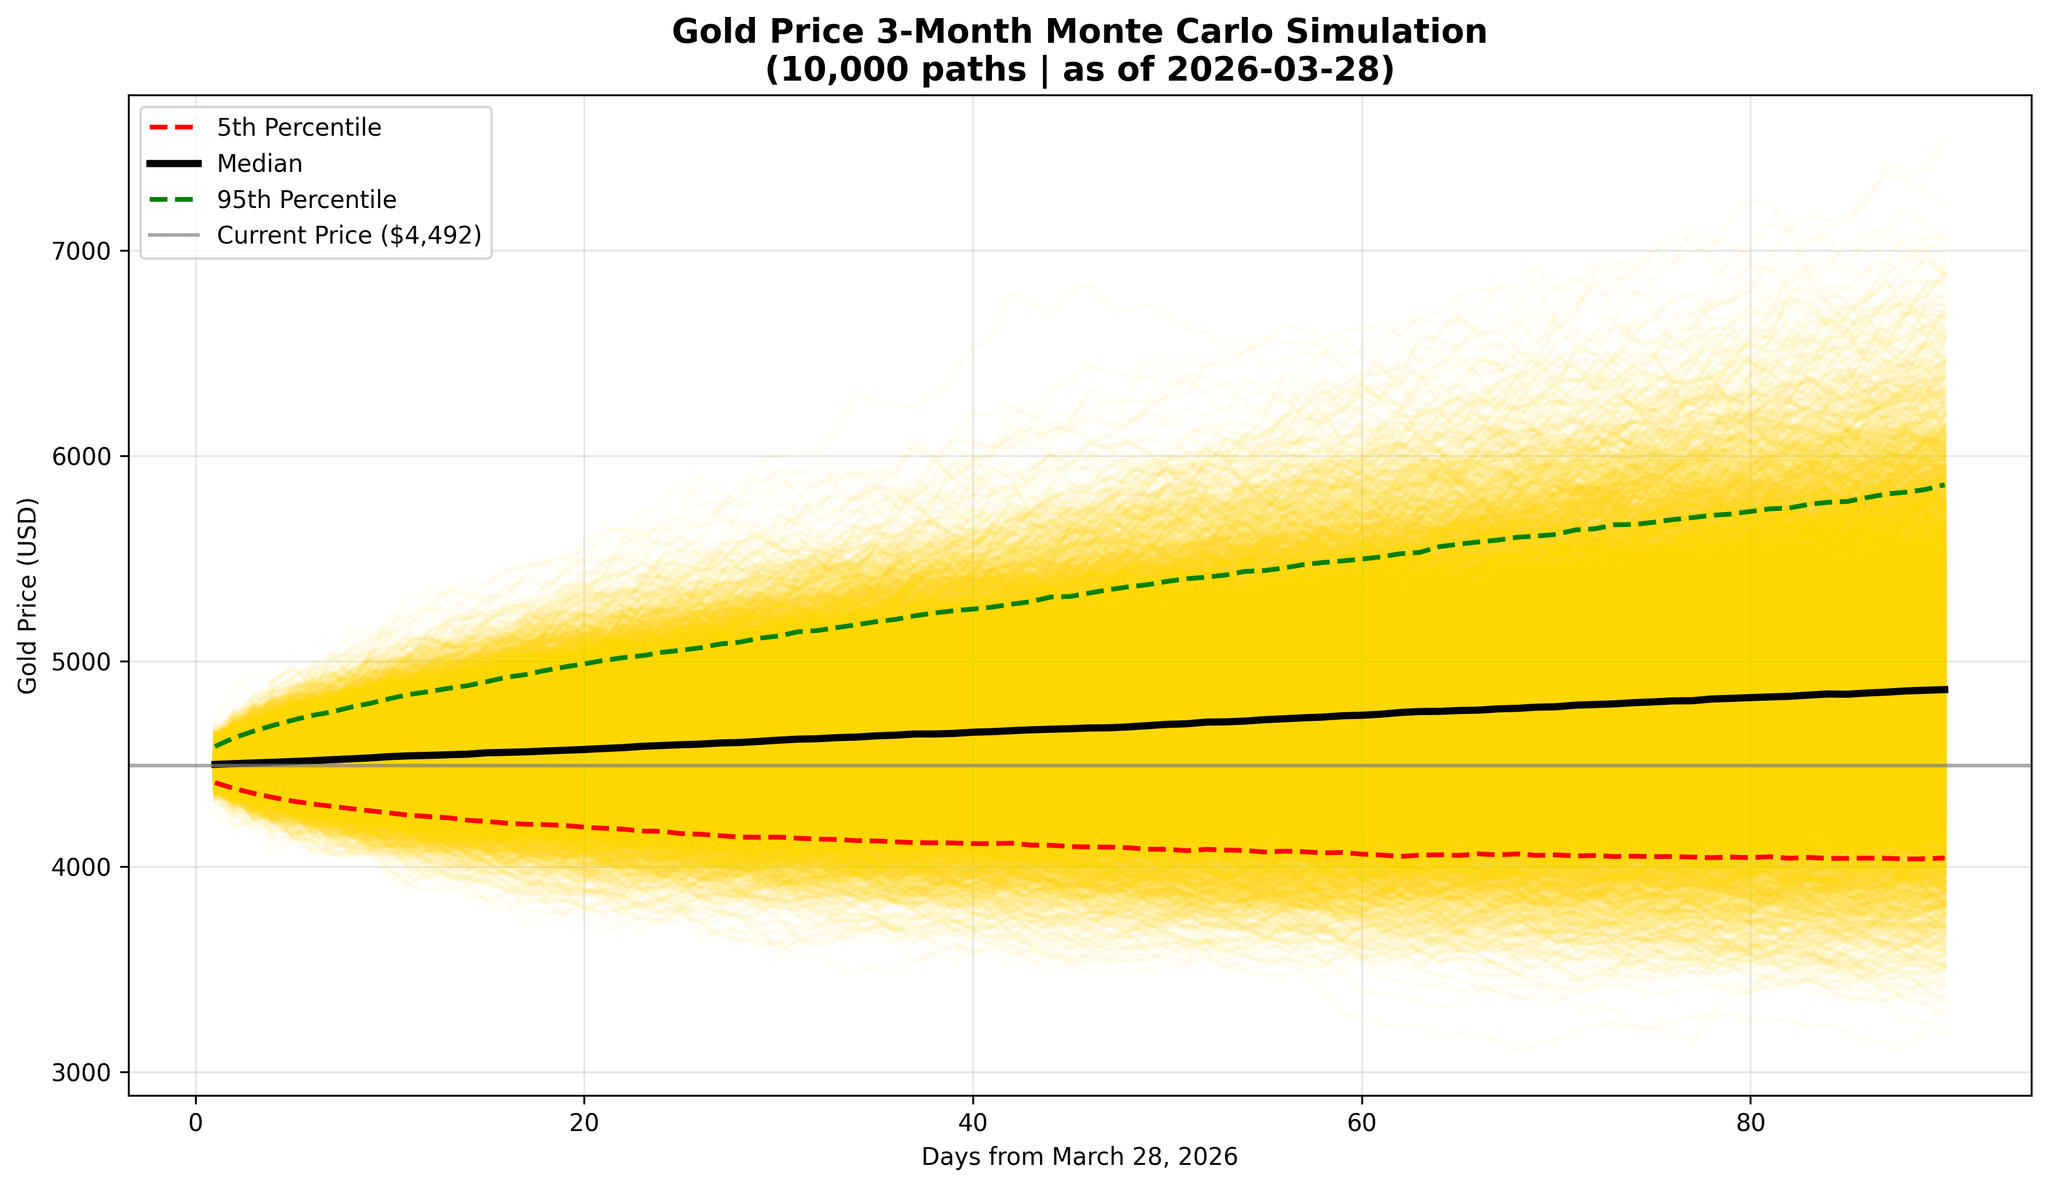
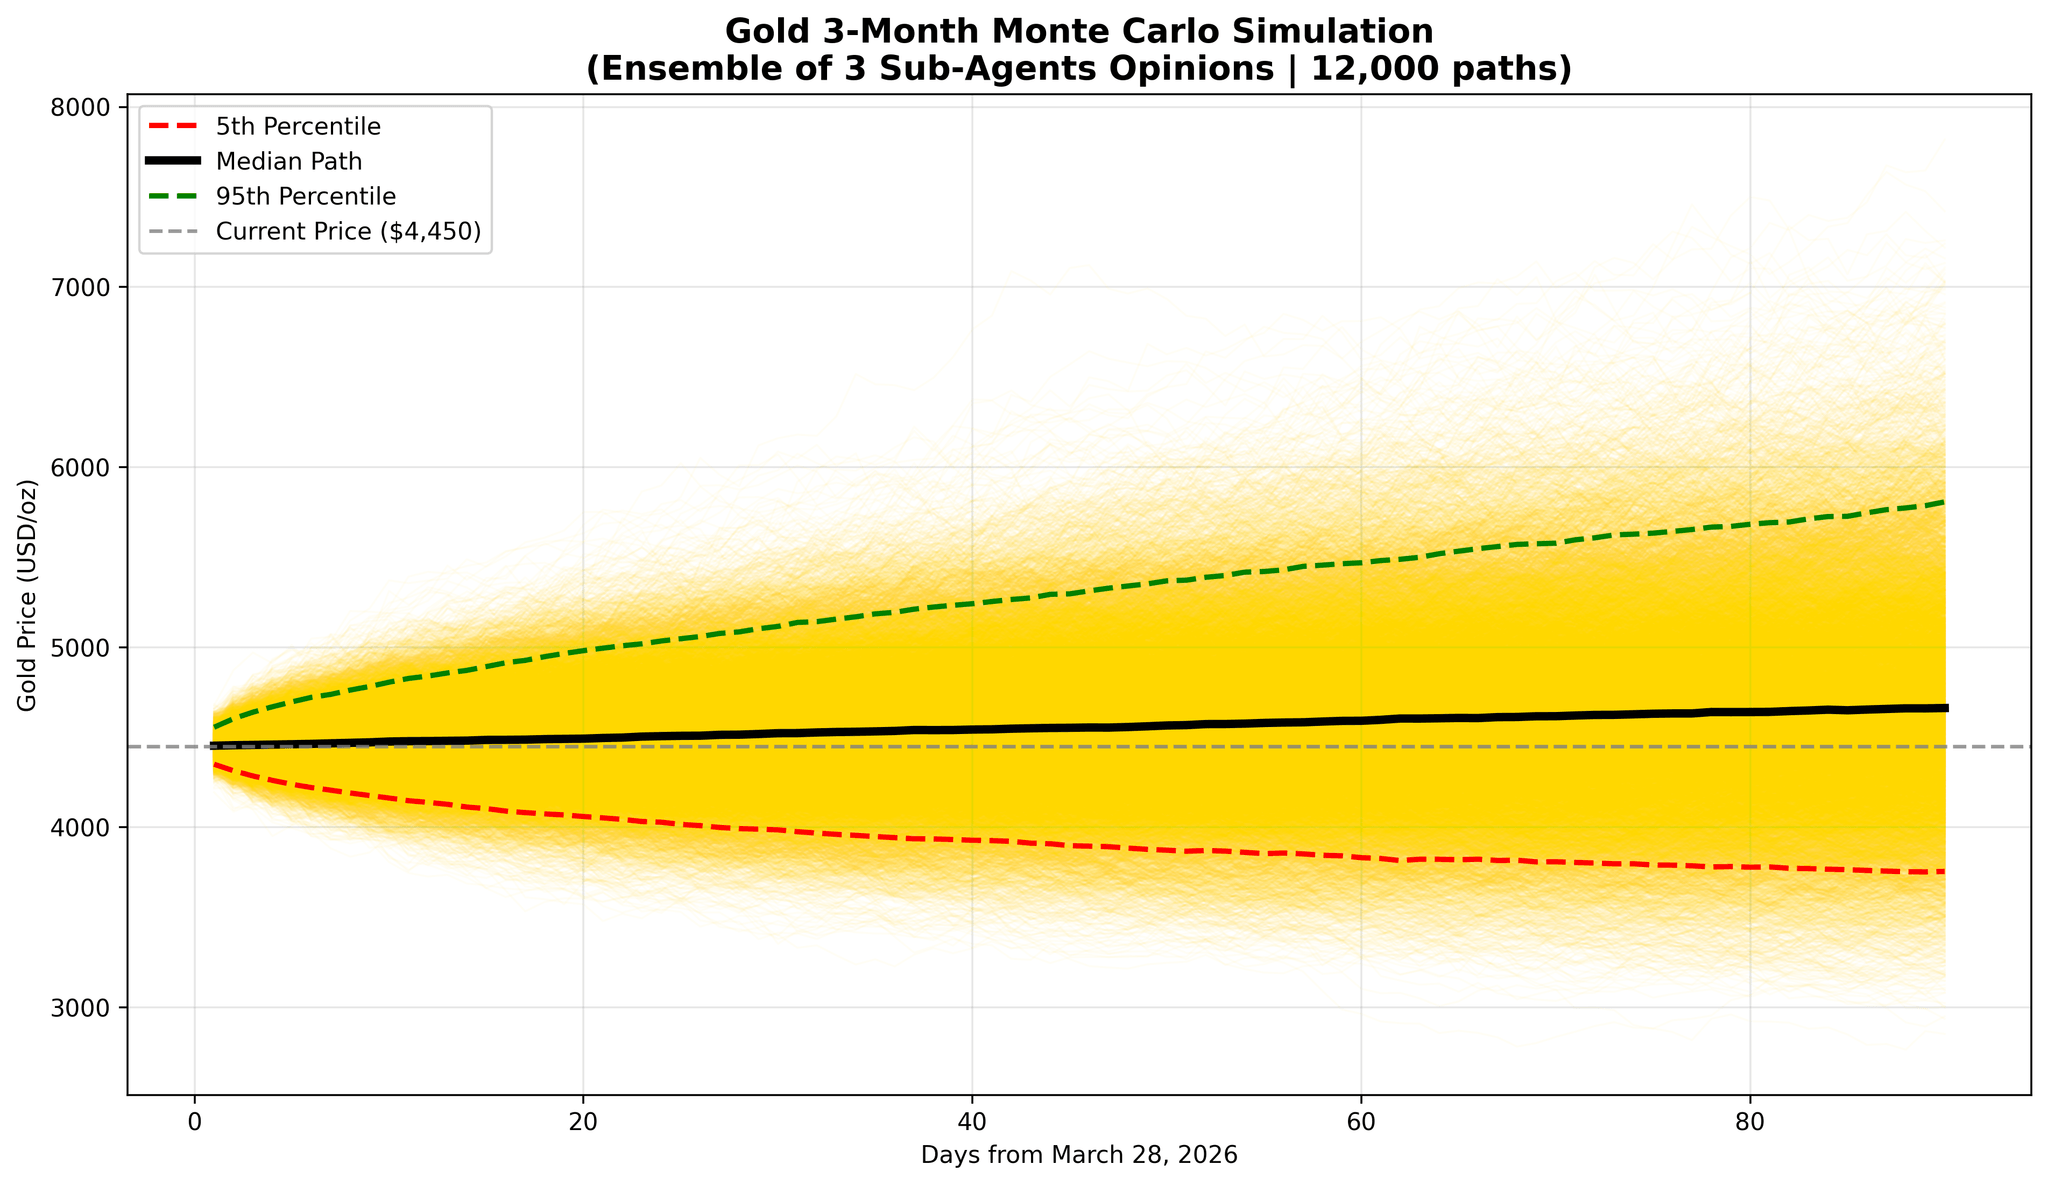
In this analysis, Aleph ran simulations using three methodologies: a single model (10,000 iterations), a three-subagent ensemble (12,000 iterations), and a Crisis-Calibrated Hybrid backtested from past crisis cases (10,000 iterations). Regardless of the methodologies, the direction was the same—bullish dominance. However, the more conservative the model, the lower the median and the wider the downside range.
📊 Simulation A — Standalone Model (10,000 iterations)
📊 Simulation B — Ensemble Model (12,000 iterations, weighted opinions from 3 agents)
The opinions of the three agents—market-researcher (Bearish), macro-analyst (Moderately Bullish), and geopolitical (Strongly Bullish)—were divided. Aleph did not hide this conflict of opinion and incorporated it into the simulation by weighting the forecasts of each agent (geopolitical 40% · macro-analyst 35% · market-researcher 25%). The honest result is that the downside range widens as the bearish opinion is included.
📊 Simulation C — Crisis-Calibrated Hybrid (LightGBM+GARCH+MC, 10,000 iterations)
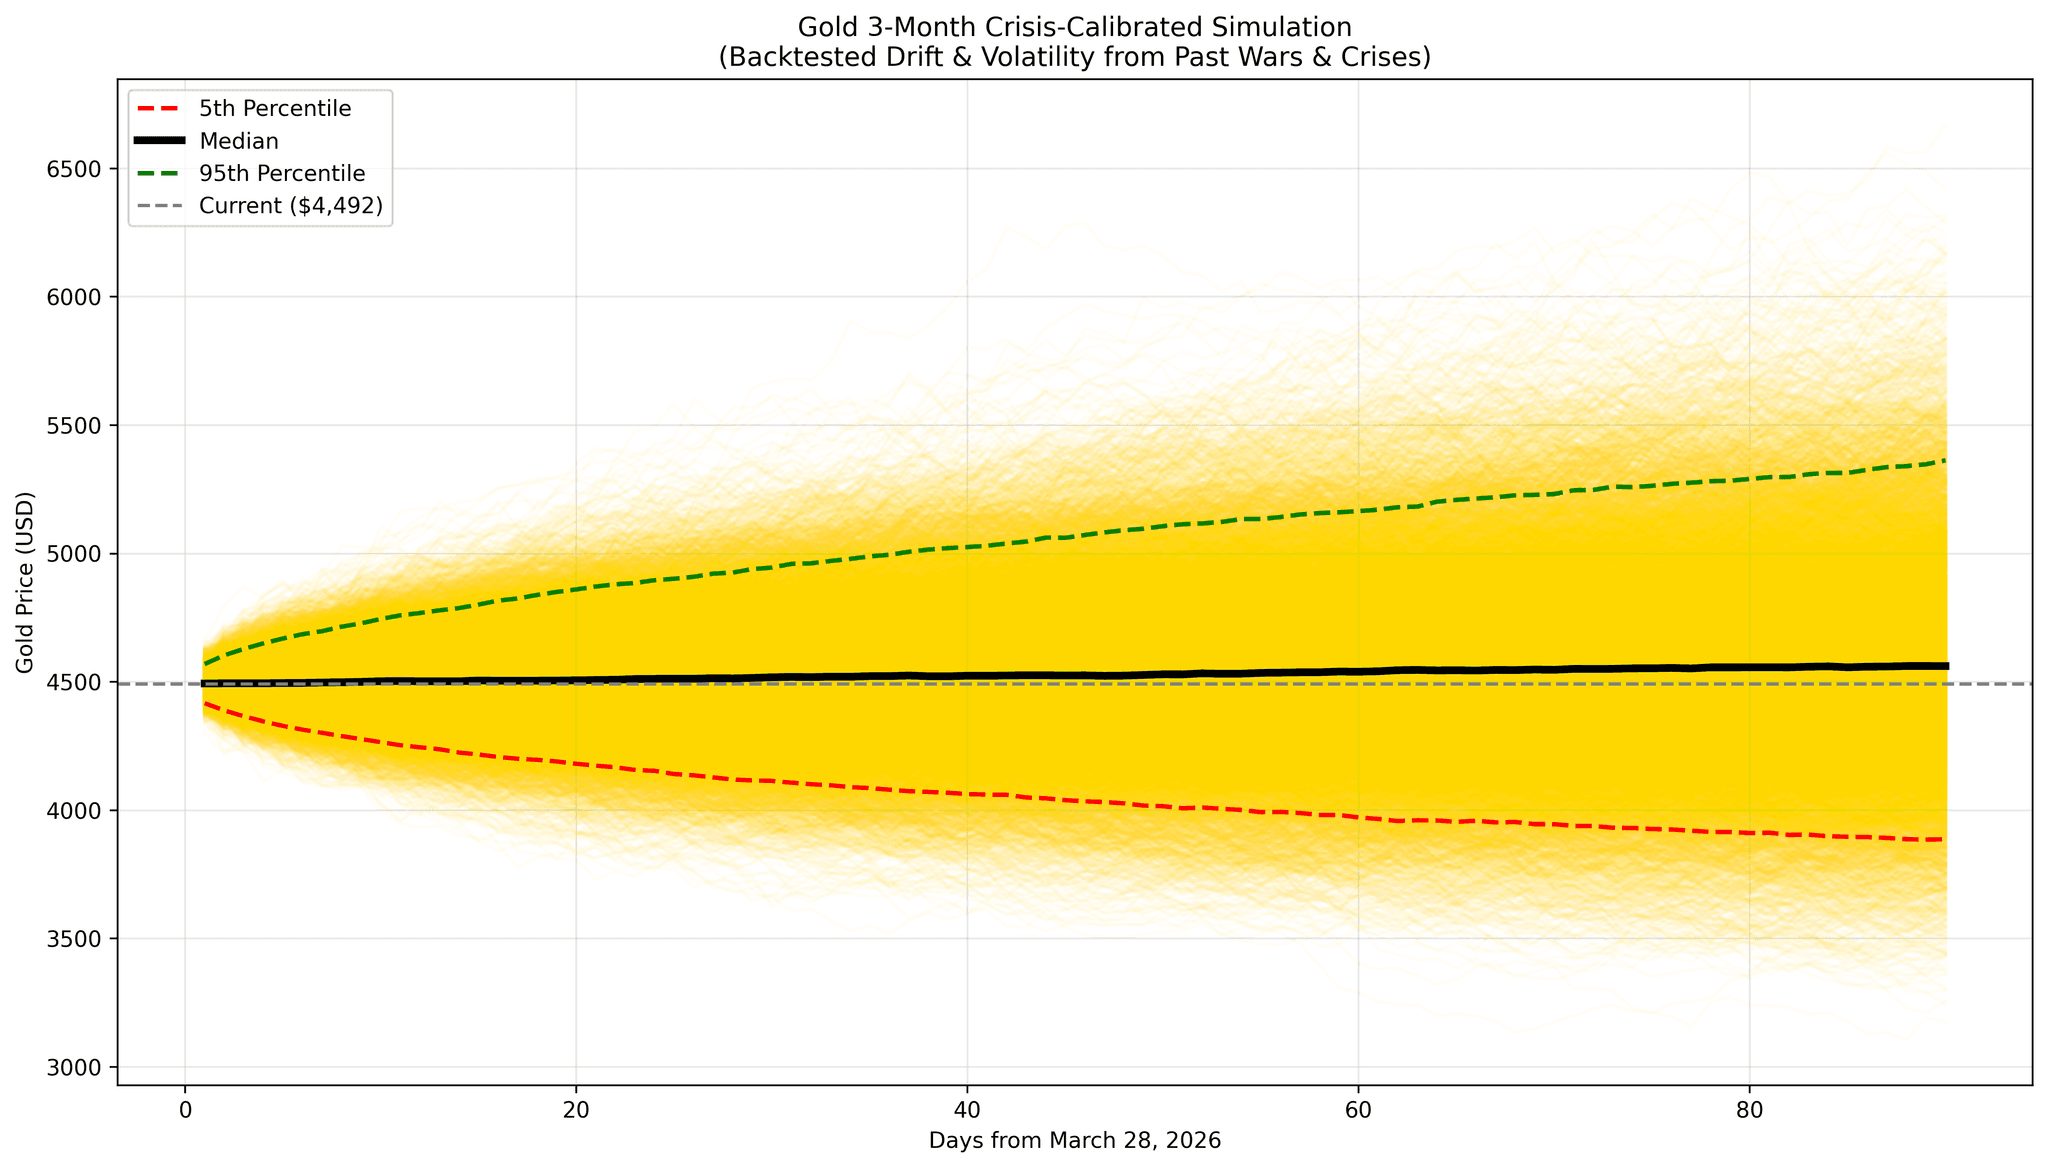
While the previous two models reflected variables of the “current situation,” this model recalibrated parameters using actual past crisis data . It applied backtesting of the actual drift and volatility of gold prices during the 2022 Ukraine War, the 2020 COVID-19 pandemic, and the 2008 financial crisis. It is a conservative version that is most faithful to “how gold actually moved during a crisis” without excessive upward bias.
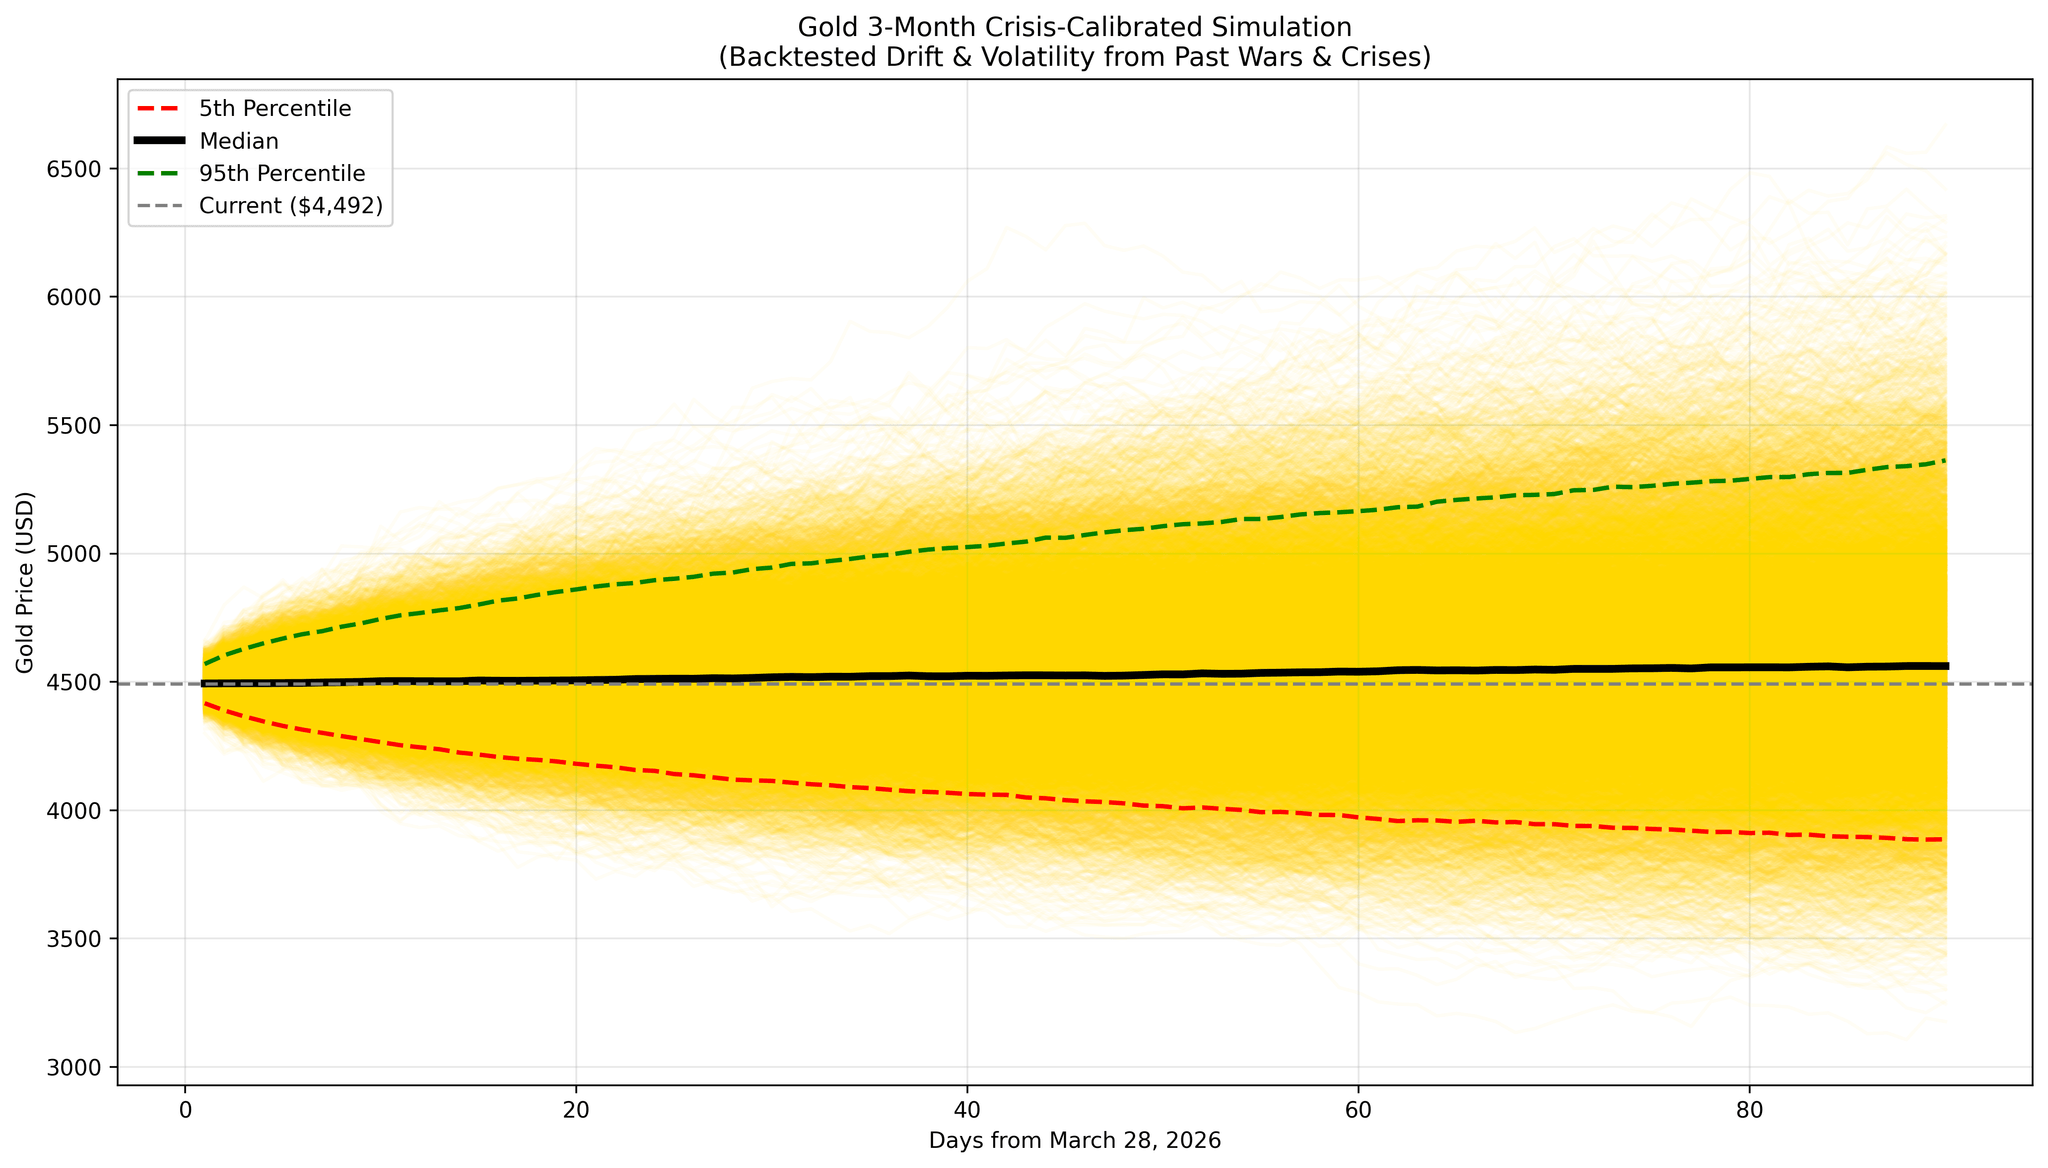
The median decreases in the order of Optimism (Single) → Conservative (Ensemble) → Realism (Risk Correction). However, all three models show a dominant bullish direction . They agree on the conclusion that the current zone is a suitable area for staggered buying. The reason the ranges differ among the models is due to differences in the “magnitude of uncertainty,” not differences in direction.
| model | methodology | median | bottom 5% | Top 5% |
|---|---|---|---|---|
| A. Exclusive Model | Monte Carlo 10,000 times | $4,861 (+8.2%) | $4,042 | $5,859 |
| B. Ensemble | 3 Agent Weighted 12,000 times | $4,663 (+4.8%) | $3,755 | $5,807 |
| C. Crisis Correction | LightGBM+GARCH+MC 10,000 times | $4,562 (+1.6%) | $3,887 | $5,363 |
※ The simulation results are statistical probability distributions and are not an investment recommendation. Model C (crisis correction) is a conservative version that recalibrated drift and volatility using actual data from the 2022 Ukraine War, 2020 COVID-19, and 2008 financial crisis.
6Trump's 'Emperor Management' — The Era Where Leaders' Psychology Moves the Market
It is wrong to analyze Trump using traditional diplomatic and military grammar. The key to understanding his decisions lies in "reality show diplomacy" and "branding strategy." Inserting his signature on banknotes, renaming the Strait of Hormuz the "Trump Strait," and designating Cuba as the next target following Venezuela and Iran—these moves have one thing in common: the desire to permanently engrave his name in history.
Historical Comparison: How Leader Hubris Shook the Market
| division | Characters / Events | Key points | Market Impact |
|---|---|---|---|
| obsession with symbols | Nicolae Ceaușescu (Romania) | Deifying himself, obsessed with building a massive palace, judgment by the people | Romania's Economic Collapse, Soaring Foreign Debt |
| Privatization of place names | Saparmurat Niyazov (Turkmen) | Extreme dictatorship that even changes the names of months to one's own or family members' names | Deepening dependence on energy exports, collapse of transparency |
| military misjudgment | Napoleon Bonaparte | Intoxicated by early victories and ignoring expert advice, the Russian expedition failed. | European War Economic Turmoil, Gold Surges as Safe-Hand Asset |
| A war for face | Leopoldo Galtieri (Argentina) | Provoking the Falklands War to overcome internal crisis → Defeat | Argentine Peso Plunges, Hyperinflation |
The goal may not be to subjugate all of Iran. It is possible that the actual exit strategy is to seize Kharg Island, the key to crude oil exports, to hold the "economic leash," and to televise a dramatic "Trump Strait victory declaration." The climax of reality shows has always been the conclusion of a dramatic deal. Investors must become viewers who predict "when the next episode will come out."
We live in an era where a leader's psychology and branding strategies, rather than geopolitical fundamentals, have become the key variables driving the market. Trump has a precedent of withdrawing an order just 10 minutes before an airstrike was to be executed following the downing of an Iranian drone in 2019. Both wars and deals can be overturned within 10 minutes. Split buying, strict adherence to stop-losses, and portfolio hedging —in a market where unpredictability is a constant, investing without rules is the most dangerous.
7“What if Trump suddenly makes a deal?” — Counterargument Handling
If this report was written on the premise of a “medium-to-long-term war,” there is a counterargument that must be addressed. This is because Trump’s most dangerous characteristic is his unpredictability .
In June 2019, Iran shot down a U.S. reconnaissance drone. Trump authorized a retaliatory airstrike but withdrew it 10 minutes before execution . The reason: “150 people could die. It is not proportional to a single drone.” (NPR, NBC) He stopped the action 10 minutes beforehand, even though the plane was already airborne and the missiles were ready. Trump is a figure who can overturn both a war and a deal within 10 minutes.
| scenario | Probability (Estimation) | Gold price forecast | Response strategy |
|---|---|---|---|
| Prolonged war (3 months+) | 50% | $4,800~$5,500 | Maintain current buying zone, continue staggered buying |
| Early conclusion of negotiations (1~2 months) | 30% | Rebound to $4,200+ after a short-term correction of $3,800–$4,000 | Opportunity to buy more below $4,200 |
| Harg Island oil infrastructure hit | 15% | Short-term plunge to $4,000 → Subsequent sharp rebound to $5,500+ | Aggressive buying during sharp declines |
| Expansion of the nuclear crisis | 5% | $6,000+ | Hold on, no need for additional purchases |
※ Probabilities are qualitative estimates based on the current geopolitical situation and are not derived from a mathematical model. This does not constitute an investment recommendation.
Even if early negotiations are concluded, a drop in gold prices below $4,200 presents an opportunity for additional buying. Reason: Central bank structural demand (755 tons/year) and the de-dollarization trend operate regardless of war. This is the basis on which JPMorgan maintains its $6,300 target.
8Investment Action Guide — What to Do Now
In the "Investment Guide for the Era of Geopolitical Risk, " Aleph compared "panic selling vs. holding" strategies using 1,000 Monte Carlo simulations (LightGBM+GARCH+MC hybrid). Result: The holding strategy showed a 6.3% advantage over panic selling ($119,108), with an average final asset of $126,565 . Selling all is not the answer.
Immediate — Split Purchase 1st Round ($4,400~$4,500)
Current price $4,492 — right in the middle of the buying zone . Do not go all-in at once. Approach this with split purchases of at least three. 1st purchase: 40% of your target weight / 2nd purchase: an additional 30% after 2 weeks / 3rd purchase: the remaining 30% after 4 weeks. If you set TradingView alerts below $4,200, you can execute stop-loss decisions without emotion.
Short-term goal — $5,100 / Mid-term goal — $5,300
Short-term target: $5,100 (+22% above the 200-day moving average), medium-term target: $5,300 (exceeding JPMorgan Q4's $5,055). The principle is to take profits of over 50% upon reaching the target price. Holding without a target allows greed to erode profits.
Stop Loss — Reduce position if $4,200 is broken
$4,200 = 200-day Moving Average + Structural Support. If this line is broken, it is a "trend reversal" rather than a "pullback." Monitoring Indicators: When DXY (Dollar Index) turns downward → strengthen gold buying / News of US-Iran negotiations → prepare for a short-term correction / Reports of damage to Kharg Island oil infrastructure → oil prices reach $200+ → gold rebounds / Fed/ECB interest rate announcements → short-term decline on hike, rise on freeze.
Gold investment products for domestic investors
| goods | category | characteristic | Recommended for |
|---|---|---|---|
| KODEX Gold Futures (H) | ETF | Currency hedging O, tracks gold price based on KRW | Investors looking to eliminate exchange rate risk |
| ACE KRX Spot Gold | ETF | Based on physical gold, capital gains tax exemption | Tax-saving investors |
| GLD / IAU | US ETFs | Dollar denominated, maximum global liquidity | investors holding overseas accounts |
| Dollar MMF + Gold ETF | mixture | Double hedging in the KRW/USD 1,500+ range | Expected to benefit simultaneously from exchange rates and gold |
March 4, when $2.91 billion flowed out of the GLD ETF in a single day, marked the largest outflow since 2016. This was a signal of panic selling by institutional investors , not an indication that gold's fundamentals have collapsed. Historically, gold has rebounded within six months following such extreme outflows. It is recommended to allocate 5–10% of your total portfolio to gold (refer to the three-tiered portfolio defense strategy from the oil shock era ).
All figures and analyses in this article are for informational purposes only and do not constitute investment advice. Monte Carlo simulations are statistical estimates based on historical data and do not guarantee actual returns. Probabilities for each scenario are qualitative estimates and not derived from a mathematical model. All investment decisions and the resulting profits or losses are the sole responsibility of the investor.
Gold at $4,492 — Crisis or Opportunity?
We are currently standing in the buying zone identified by Aleph a week ago. Harg Island is becoming the switch for war, and JPMorgan is talking about $6,300. Three simulations using different methodologies all pointed in the same direction —bullish dominance, and the current zone is for split buying. Trump's next move could change within 10 minutes, but central bank gold buying and the de-dollarization trend operate regardless of whether war breaks out. We share geopolitical risk and gold investment analysis every week.
How this content was produced
Aleph's research AI agent assisted with collecting and analyzing public data, creating charts and visuals, and structuring the draft. Davar personally reviewed and edited the sources, figures, reasoning, and final conclusions.
This content is for informational purposes only and is not personalized investment advice or an individual stock recommendation. Read the full disclaimer

Davar
Davar builds and operates Aleph's research AI agent and writes and reviews analysis on macroeconomic developments and AI industry trends.
© Aleph. All rights reserved.