
Top 5 Tech Companies Based on Capital Investment Relative to Operating Cash Flow — The Next Stage of AI CAPEX Competition in 2026
Until now, the standard for AI investment was simple: who could secure more GPUs and data centers first. However, entering 2026, the ways in which these funds are managed began to diverge even within the Big Tech group. Microsoft invested $115.9 billion in facilities in a single year and still had a surplus of $67 billion, while Oracle generated $32 billion in operations and spent $55.7 billion. What distinguished the two was not the scale of investment, but the cash generation capacity supporting it. However, I believe it is too early to interpret these figures directly as a report card indicating who is performing well and who is not. This is because it takes several quarters after investment for data centers to generate revenue. In this article, I compared how much of the cash generated from operations five companies are reinvesting back into facilities. I also examined how much can be said about them based solely on these numbers.
Even if it is $100 billion like ⟦NUMX⟧, the burden is different.
The burden of AI investment is not revealed solely by the amount of capital expenditure. This is because the amount of cash generated varies from company to company. Microsoft spending $100 billion is not a decision of the same weight as Oracle spending $50 billion.
This blog has consistently followed AI investment from the perspective of the capital market. In "What is a Term Premium?" and "Government Bond Buybacks Are Not QE," we examined long-term interest rates and the money supply; in "The Theory on AI Speed Control" and "Interest Rates Risen, Yet AI Stocks Rised," we explored why AI investment continues despite the increased cost of capital. Now, the next question remains: Who is actually making the most of that expensive money?
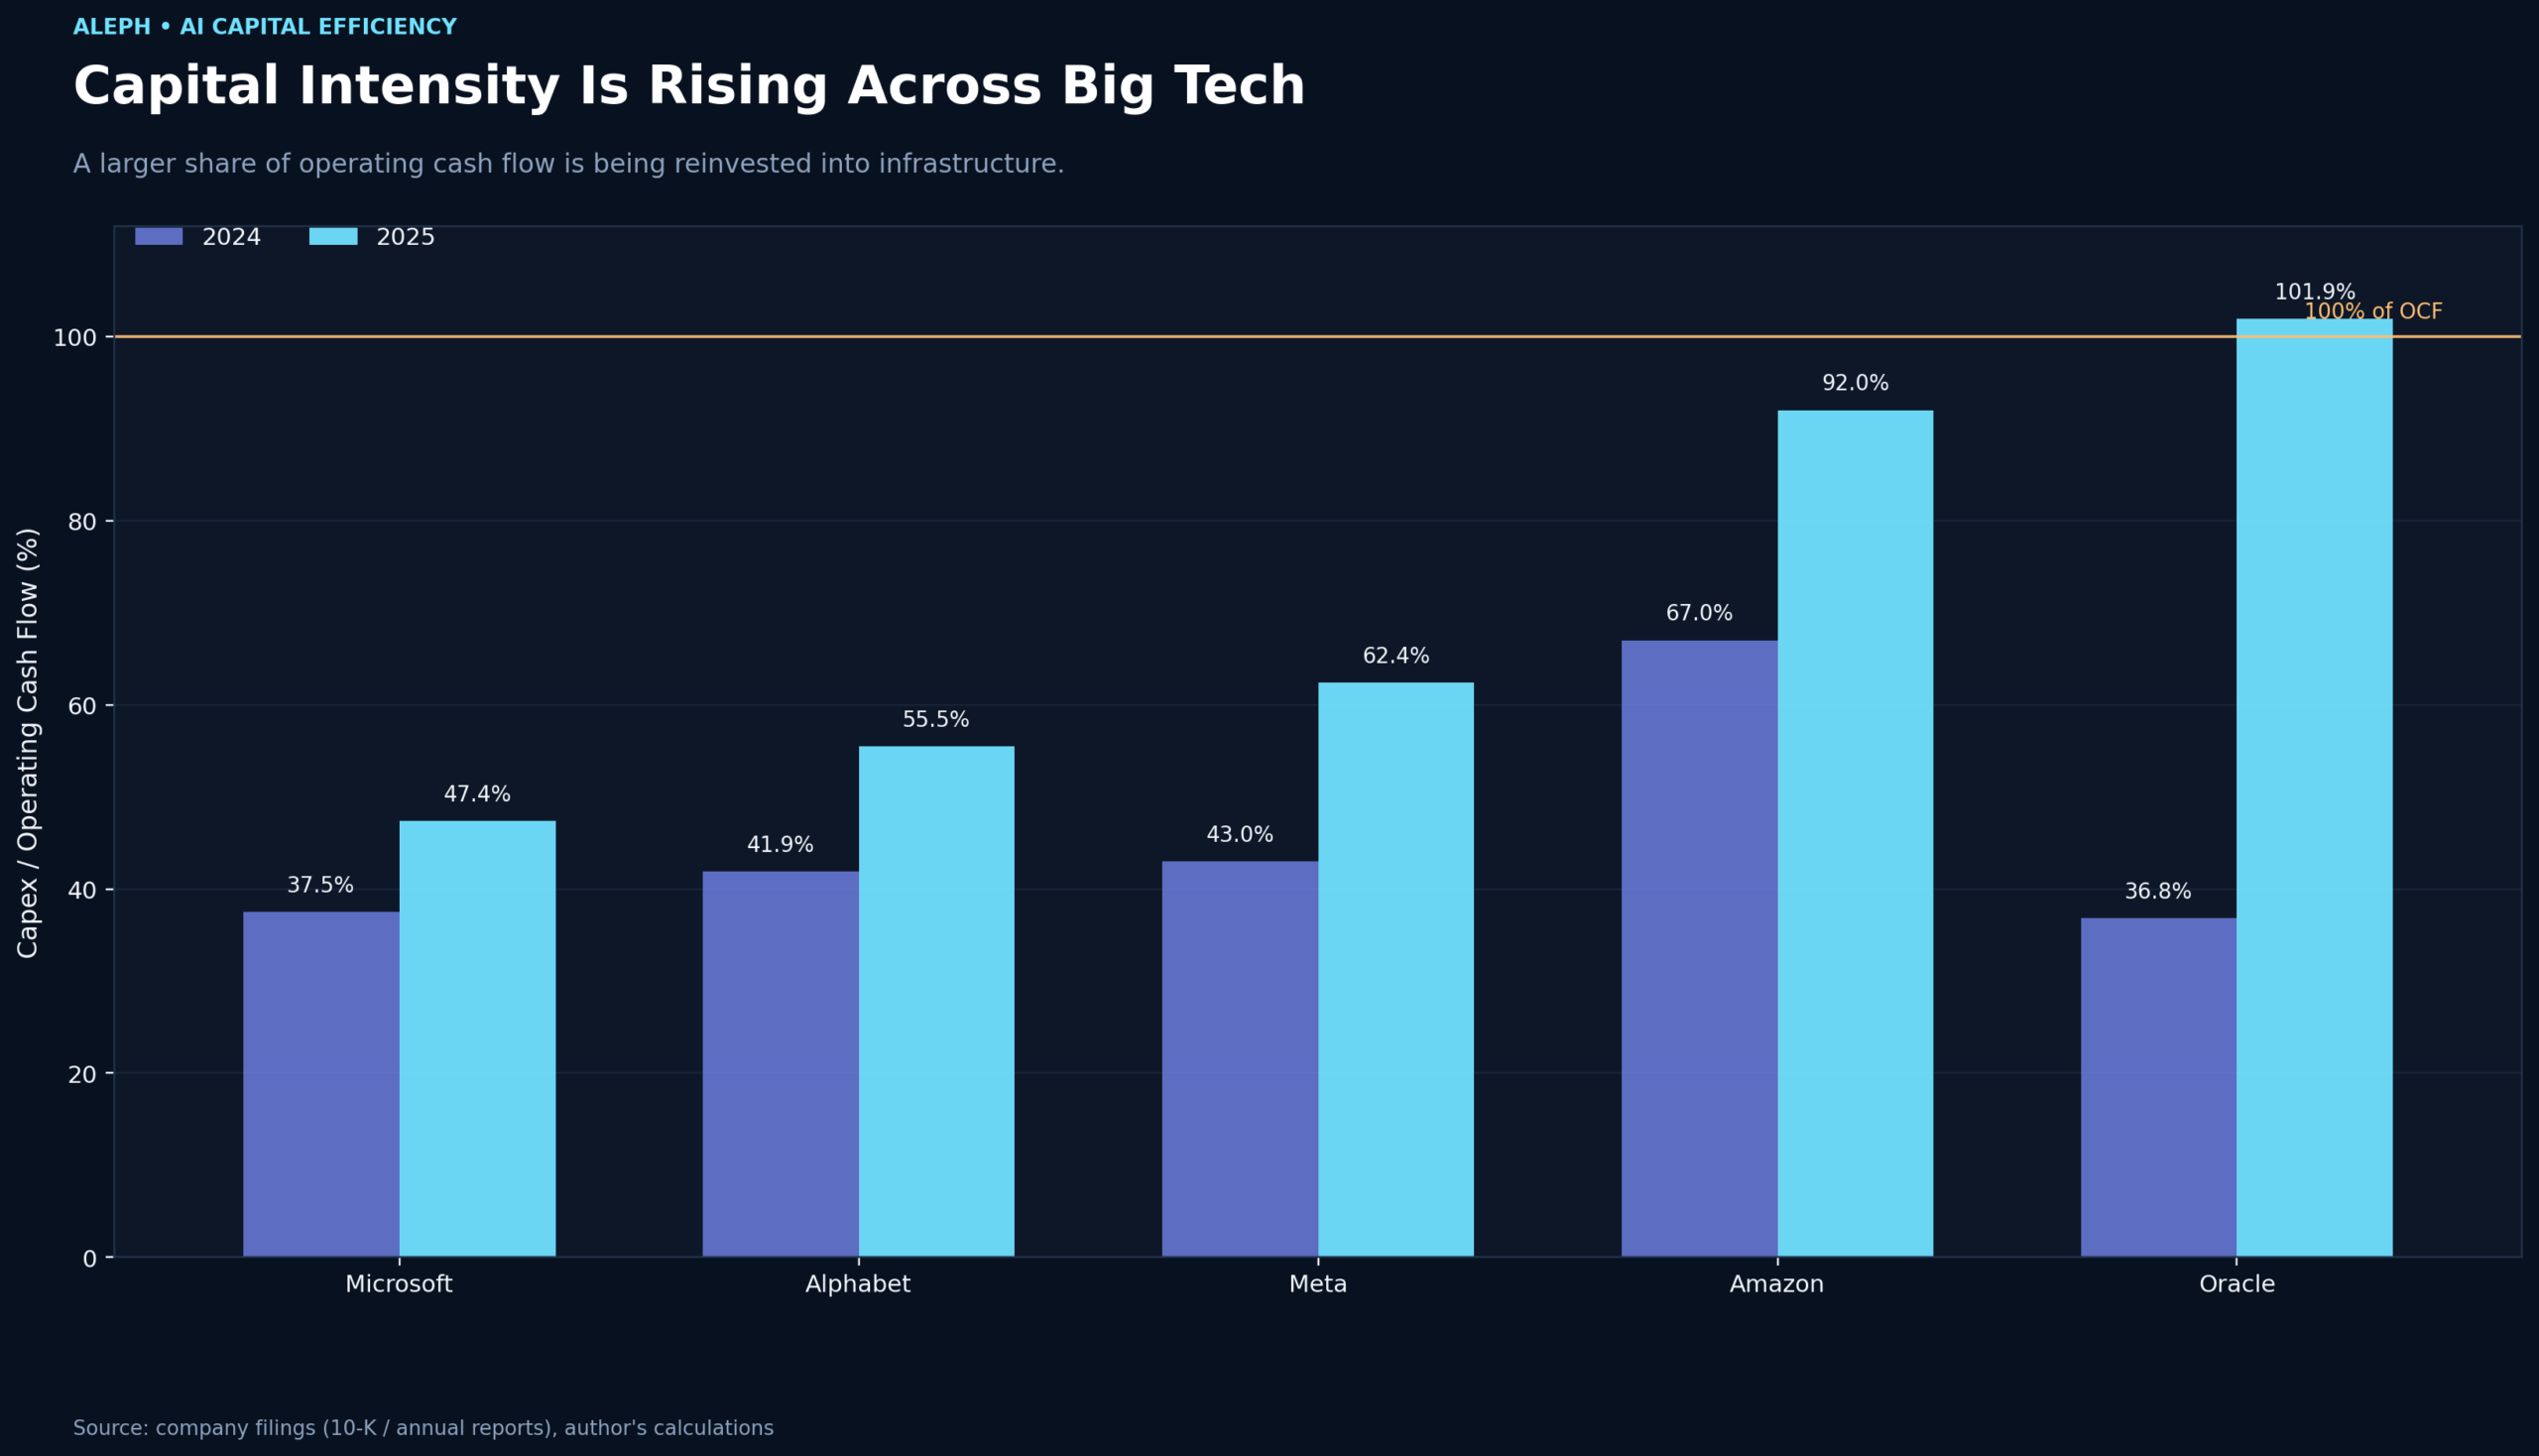
So, the first value we look at is the ratio of capital expenditure to operating cash flow . In English sources, it is written as Capex / Operating Cash Flow. It is a value that shows how much of the cash generated from operations is put back into facilities, and if it is 100%, it means that virtually all of the cash generated from the business that year was put into facilities.
Based on 2025 figures, Microsoft stood at 47.4% , Alphabet at 55.5% , Meta at 62.4% , Amazon at 92.0% , and Oracle at 101.9% . One year prior, they were 37.5%, 41.9%, 43.0%, 67.0%, and 36.8%, respectively.
The ratios increased for all five companies, but the magnitude varied significantly. While Microsoft rose by nearly 10 percentage points, Oracle jumped from 36.8% to 101.9%. Amazon generated $139.5 billion in cash from operating activities in 2025 and spent $128.3 billion on cash-based capital expenditures. Alphabet earned $164.7 billion and invested $91.4 billion. Meta spent approximately $72.2 billion out of $115.8 billion, combining capital expenditures and financial lease principal.
2So how much is left
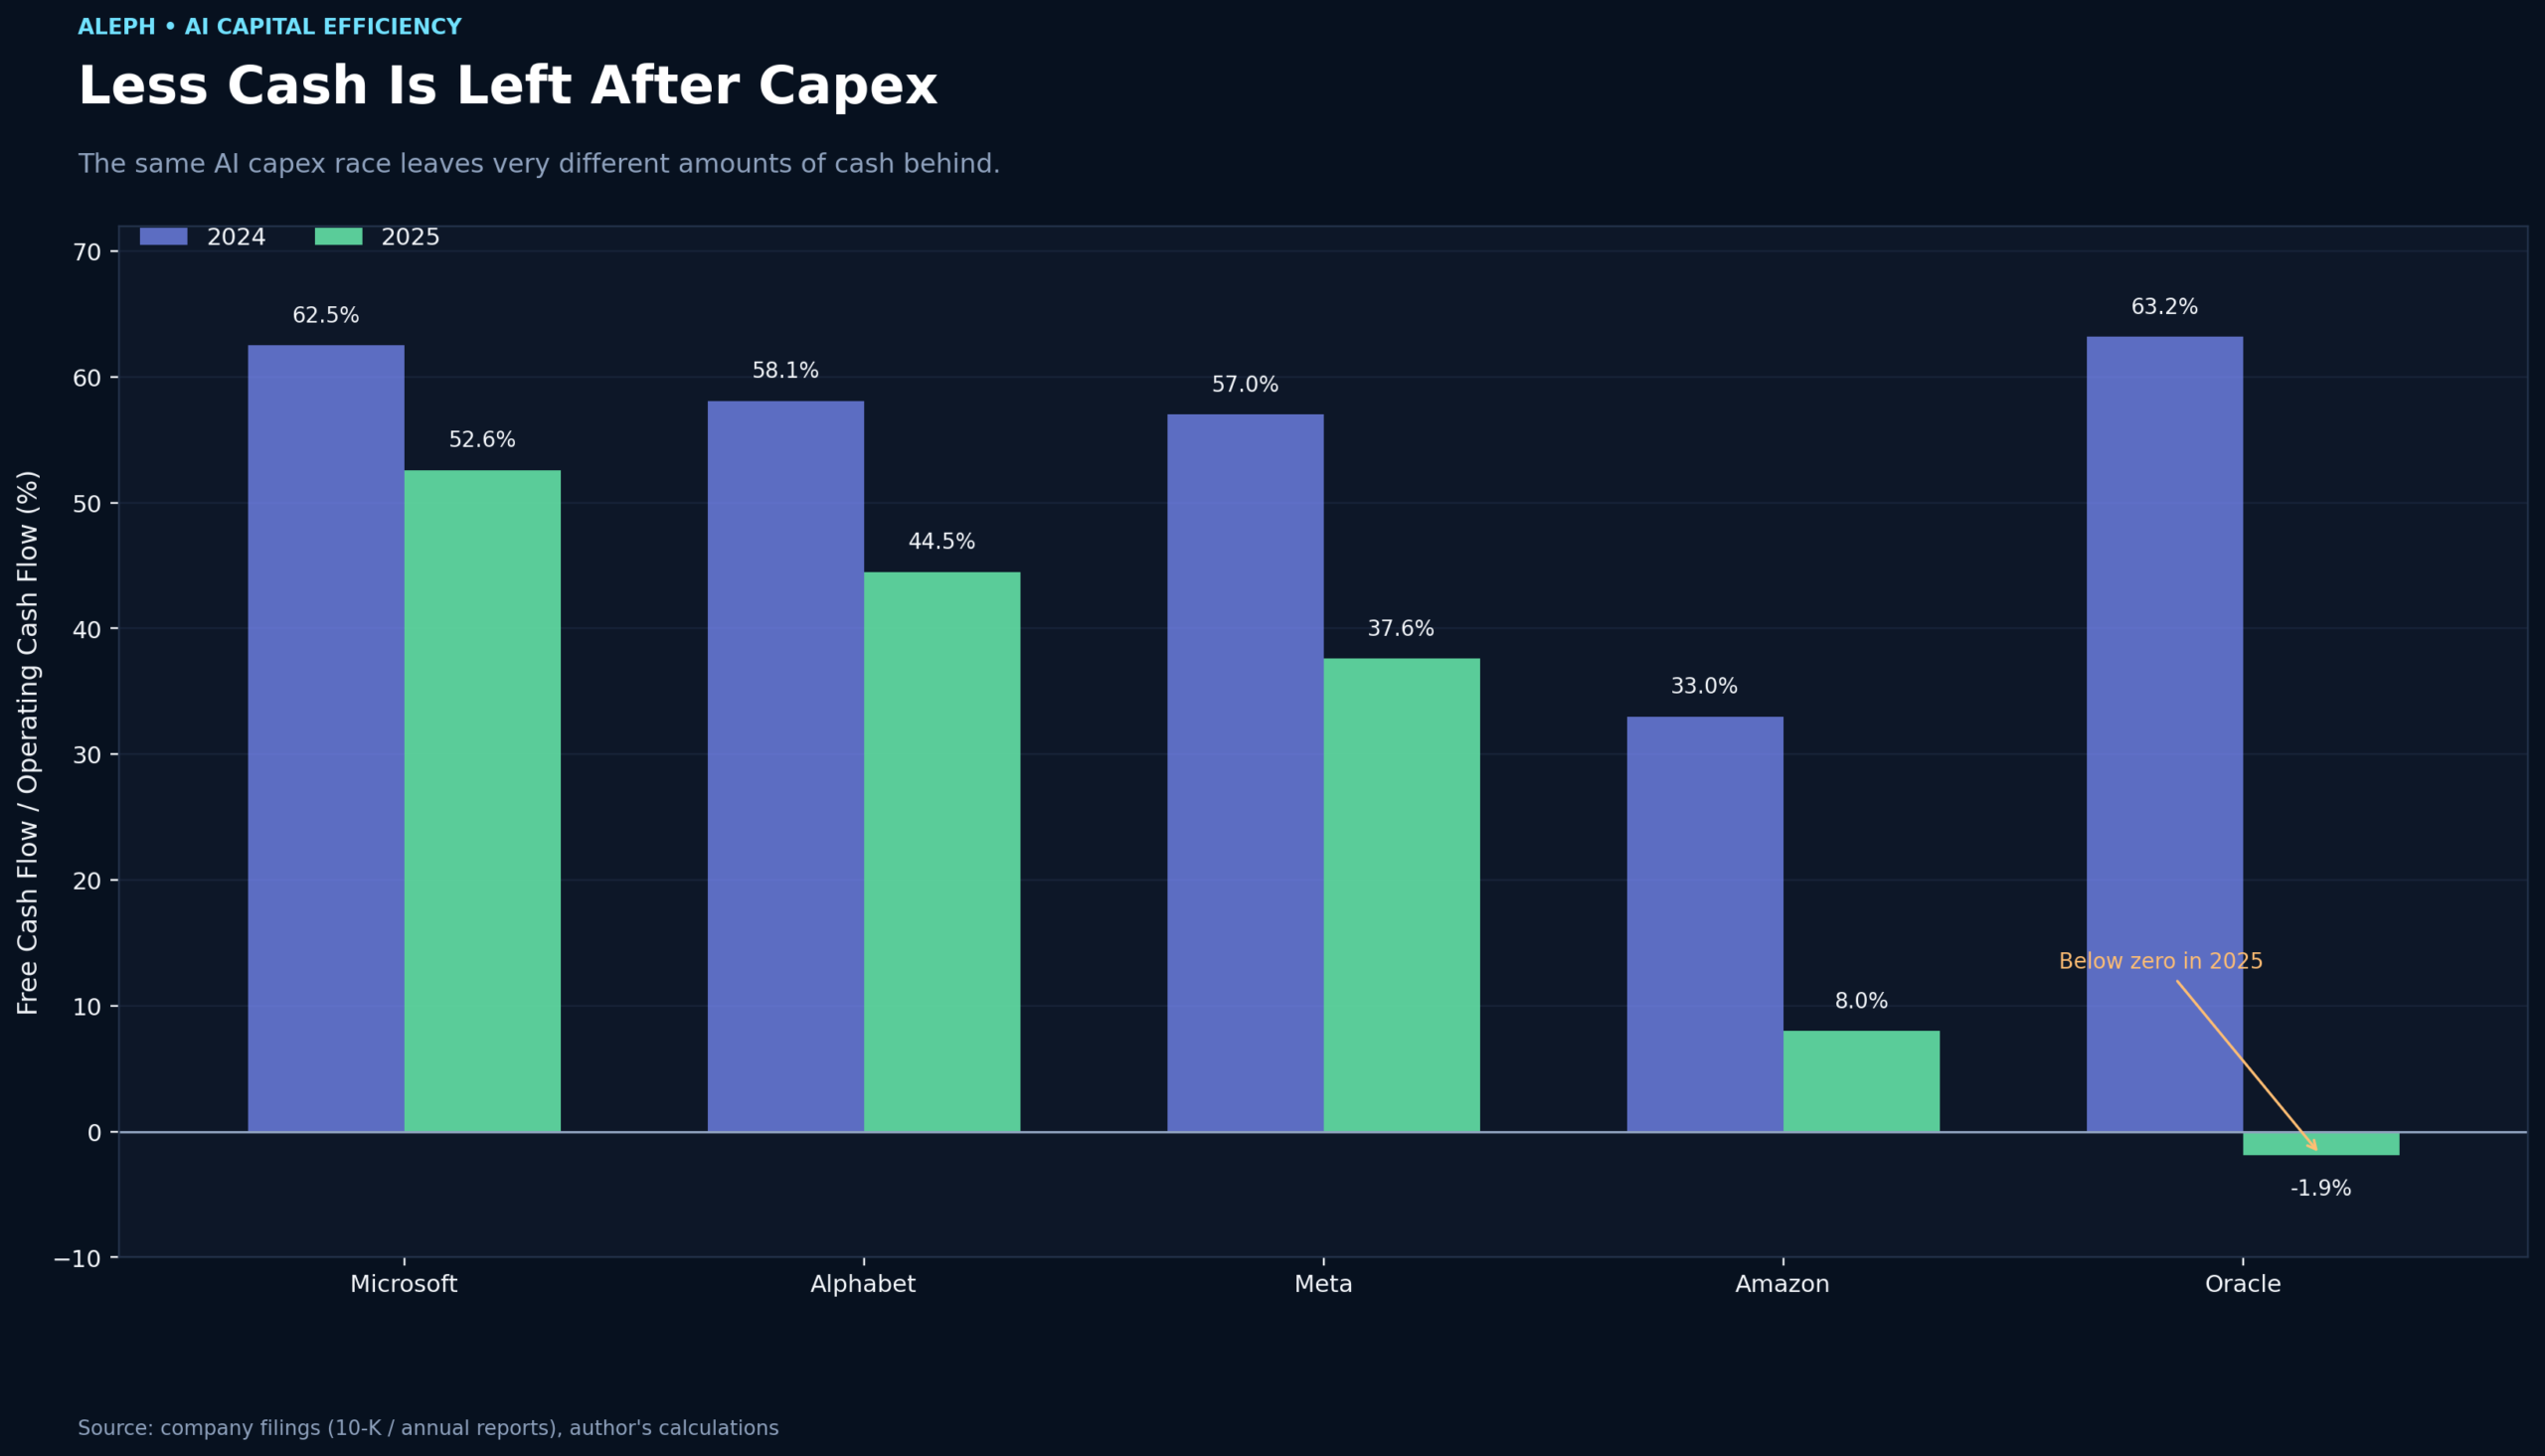
If you look only at the capital investment ratio, a company that is actively investing appears worse than it actually is. Therefore, I also looked at free cash flow relative to operating cash flow . This value indicates how many cents remain after completing capital investment for every dollar earned from operations.
In 2025, Microsoft was 52.6% , Alphabet 44.5% , Meta 37.6% , Amazon 8.0% , and Oracle -1.9% .
Here, the gap becomes much clearer. Just a year ago, even Oracle retained 63% of its operating cash. That ratio dropped below zero in just one year. Amazon fell from 33% to 8%. Only Microsoft retained more than half of its operating cash, even after significantly increasing its capital expenditures.
This is also why I have continuously examined long-term interest rates and the financing issues of AI companies in previous articles. If the cost of capital is low, the burden of raising cash from external sources is small. However, the situation changes if the U.S. 10-year Treasury yield remains around 5% for an extended period. This is because when investment exceeds internal cash flow, where that money is secured becomes just as important as how much the business grows.
3 Why You Should Not Call This Number the AI Investment Return
The two indicators discussed so far are merely observations of capital burden, not the return on investment for AI. Failing to make this distinction makes it easy to misinterpret the figures that follow. There are three limitations.
First, the fiscal periods are not exactly the same. Microsoft's fiscal year ends in June, while Oracle's ends in May. Amazon, Alphabet, and Meta close in December. The number grouped as "2025" in this article contains a time lag of up to just over half a year. In a phase where capital investment is increasing by billions of dollars every quarter, half a year is not a short period. It is safer to use this time to look at the direction and scope rather than to rank them down to the decimal point.
Second, corporate capital investment includes investments that are not related to AI. Amazon's capital investment includes logistics centers, while Alphabet's includes facilities for running search and YouTube. Although Amazon has stated in its disclosures that the majority of its technology infrastructure investment supports AWS growth, the scopes of the numerator and denominator do not exactly overlap.
Third, there is a time lag between capital investment and revenue. GPUs installed in 2026 will not generate all of that year's revenue. Therefore, the mere fact that this year's free cash flow is negative does not mean that the company is using capital inefficiently. Furthermore, structures such as lease processing, customer prepayments, and equipment supplied directly by customers vary from company to company.
Additionally, Amazon's capital expenditure of approximately $169 billion over the past 12 months through the first half of 2026 is a figure calculated by working backward from the company's announced operating cash flow and free cash flow. Since the announced figures have been rounded, it is an approximation rather than an exact amount.
4 How much did cloud revenue increase when $1 was invested?
The next value to look at after capital burden is how much cloud revenue has increased per dollar of capital investment . While the previous two indicators show who can afford this investment, this value reveals whether that money is actually being converted into revenue. Among the data we currently have, this is the indicator closest to capital efficiency.
The calculation is simple. The increase in cloud-related revenue for that year was divided by the company's total capital expenditure for that year. Since the limitations mentioned in Chapter 3 apply as is, this should be interpreted only as an approximation of the degree of capital conversion into revenue, rather than as a return on investment. Microsoft does not disclose pure Azure revenue separately, so the Server products and cloud services revenue from its 10-K report was used. The scope of this item differs from the Microsoft Cloud that Microsoft uses in its earnings reports.
| Companies (Fiscal Year 2025) | Increase in cloud revenue | Company-wide capital investment | per dollar of equipment investment |
|---|---|---|---|
| Microsoft (Server and Cloud Services) | +$18.6 billion | $64.6 billion | About $0.29 |
| Oracle (Cloud) | +$4.7 billion | $21.2 billion | About $0.22 |
| Alphabet (Google Cloud) | +$15.5 billion | $91.4 billion | About $0.17 |
| Amazon (AWS) | +$21.1 billion | $128.3 billion | About $0.16 |
※ Since the denominator is company-wide capital expenditure and the numerator is the increase in revenue from the cloud sector, this is not a formal return on investment. Due to varying business scopes across companies, this metric is more suitable for tracking internal changes within each company rather than making absolute comparisons between firms. This is not an investment recommendation.
In this simple calculation, Microsoft yields the highest value. However, since the scope of business included in capital investment varies for each company, it is difficult to rank the investment efficiency of the four companies based solely on this figure. The denominators of Amazon, which builds logistics centers, and Oracle, a software company, are fundamentally different in nature.
Although Oracle had the heaviest capital burden, its return on investment turned out to be higher than that of Alphabet and Amazon. The fact that capital investment is heavy does not mean that money is being spent recklessly.
However, in 2026, the figures for Microsoft and Oracle moved in different directions. In FY2026, Microsoft's revenue from server and cloud services increased by approximately $31 billion, rising from $98.4 billion to $129.4 billion , while capital expenditures amounted to $115.9 billion during the same period. At approximately $0.27 per dollar, the rate of conversion to revenue remained nearly unchanged even as investment nearly doubled. For Oracle, cloud revenue increased by $9.5 billion, rising from $24.5 billion to $34 billion, and with capital expenditures at $55.7 billion, the rate dropped to approximately $0.17 per dollar. Based solely on current figures, it appears that for Oracle, capital expenditures are proceeding ahead of revenue recognition.
5Amazon and Google aren't failing to make money
Amazon and Alphabet's cloud businesses are actually becoming more profitable rapidly. The reason for the deterioration in the two companies' free cash flow lies elsewhere.
AWS revenue increased from $90.8 billion in 2023 to $107.6 billion in 2024 and $128.7 billion in 2025. During the same period, AWS operating profit rose from $24.6 billion to $39.8 billion and $45.6 billion. In the second quarter of 2026, AWS revenue increased 37% year-over-year, and operating profit jumped from $10.2 billion to $16.6 billion .
However, during the same period, Amazon's total free cash flow fell into negative territory. The company cited a $66.1 billion increase in capital expenditures compared to the previous year as the primary cause. This was not because AWS was not making money, but because the speed at which next-generation infrastructure was being deployed outpaced the cash generated.
The changes at Google Cloud are even greater. Operating profit increased from $1.7 billion in 2023 to $6.1 billion in 2024 and $13.9 billion in 2025. While revenue grew from $33.1 billion to $58.7 billion, profits multiplied eightfold. In the second quarter of 2026, cloud revenue reached $24.8 billion, an 82% increase year-over-year.
However, it is difficult to say that Alphabet's investment efficiency has already been proven. This is because capital expenditures in the same second quarter amounted to $44.9 billion, surpassing operating cash flow of $39.1 billion. Looking at the first half of the year as a whole, operating cash flow was $84.9 billion and capital expenditures were $80.6 billion, representing a ratio of 95%. It has reached this level in just one year from 55.5% in 2025.
The answer to whether Google Cloud will grow is already clear. What needs to be looked at now is not the growth rate, but whether the pace of profit growth shown in 2025 can handle the increased investment burden in 2026.
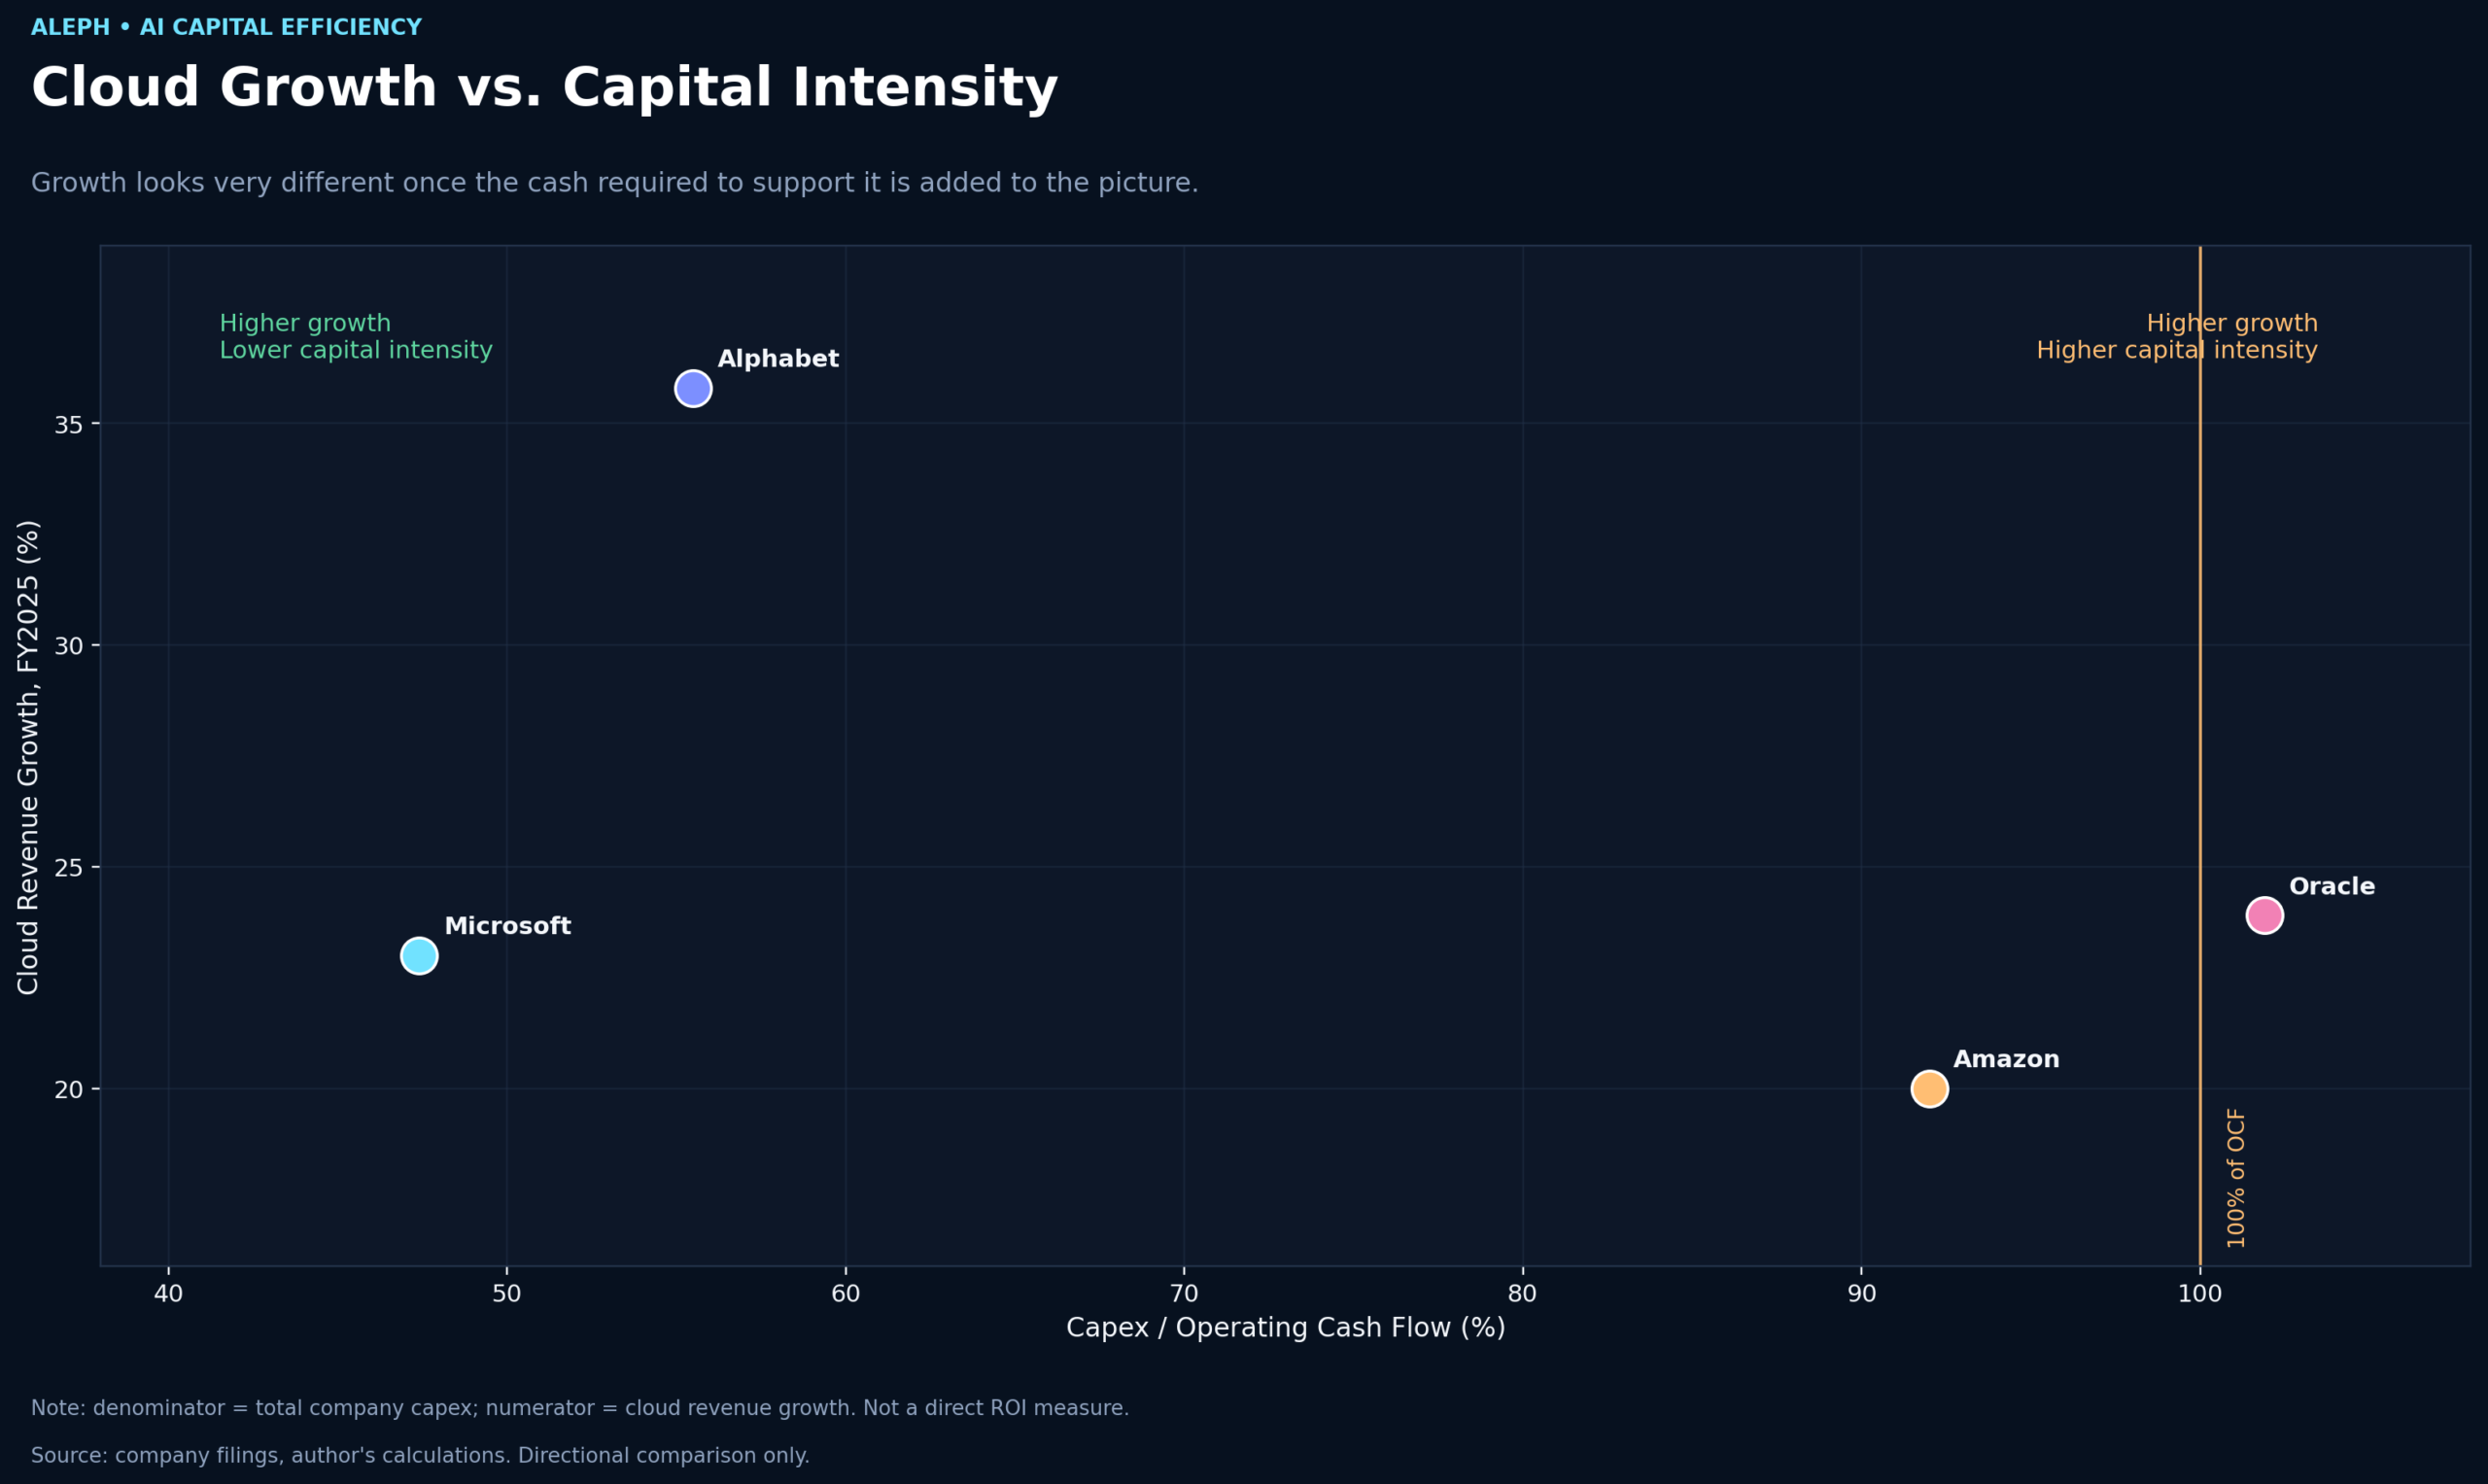
Looking solely at cloud growth rates for 2025, Microsoft, Google Cloud, AWS, and Oracle Cloud are projected at approximately 23%, 36%, 20%, and 24%, respectively, with all four performing reasonably well. However, the picture changes when capital burdens are taken into account. While Alphabet grew the fastest among the four, its corporate capital expenditure stood at 55.5% of its operating cash flow. Amazon grew more slowly, yet its capital expenditure reached 92%. This is a difference that was not apparent from the growth rate alone.
6Oracle — What to Look For on the Aggressive Side
It is still difficult to judge Oracle's success or failure because investment is far ahead of revenue. However, in terms of the speed at which infrastructure revenue is growing, it is the steepest among the five companies.
In the first quarter of FY2027 announced on September 10, total revenue increased by 30% to $19.3 billion, while cloud revenue rose by 62% to $11.6 billion and OCI revenue increased by 121% to $7.4 billion. Although not yet recognized as revenue, the Reward Points (RPO), which represent contracted amounts, accumulated to $664 billion , and new AI cloud contracts also exceeded $30 billion.
However, looking at the single year of FY2026, operating cash flow was approximately $32 billion and capital expenditures were approximately $55.7 billion. This means that 174% of the cash generated from operations was spent on facilities, and free cash flow was -$23.7 billion. This pace cannot be sustained with internal cash alone. Customer prepayments also contributed to the operating cash flow, and Oracle disclosed that approximately $4.6 billion in prepayments was included in the increase for FY2026.
The situation has changed slightly in the most recent quarter. In the first quarter of FY2027, operating cash flow was $23.1 billion and capital expenditures were $28.5 billion, bringing the ratio down from 174% to 123% . While spending still exceeds cash generated, this figure represents an improvement over the FY2026 average. Such changes go unnoticed if one simply concludes that Oracle is a company that spends capital recklessly.
Therefore, Oracle must look at two things together: how quickly the $664 billion in contract balance is converted into revenue and cash , and whether this ratio, which has fallen to 123%, continues to decline. The issue discussed in the previous article, "Government Bond Buybacks Are Not QE," reconnects here. Both the government and AI companies are in a situation where they must raise long-term funds at the same time. As long-term interest rates remain high, the interest and financing burdens for companies relying on external funds are bound to increase.
The reason for removing 7Meta from the same axis
Meta was intentionally excluded from the cloud growth rate comparison because the very path to making money with AI is different.
For Microsoft, AWS, Google Cloud, and Oracle, data center investments translate relatively directly into cloud revenue. Meta improves recommendation algorithms and ad targeting, boosts usage time and ad performance, and then generates revenue from its existing advertising business.
However, there are signs that AI investment is actually contributing to advertising revenue. In the second quarter of 2026, Meta's revenue rose 28% to $60.8 billion, while ad impressions increased by 14% and ad rates by 12%. The simultaneous rise in ad volume and rates suggests that improvements in AI recommendation and targeting are likely boosting the profitability of the existing advertising business. However, of the $31.9 billion in operating cash flow for the same quarter, $31.1 billion went towards capital expenditures and financial lease principal. Free cash flow stood at $780 million, nearly disappearing from $8.5 billion a year earlier. The company projected capital expenditures for 2026 to be between $130 billion and $145 billion.
Ultimately, there is only one thing to verify on Meta: how much greater is the additional advertising revenue generated by AI than the additional costs involved in AI infrastructure and inference? It is difficult to separate this value based solely on currently available data. This is the reason why they were not forcibly placed on the same level as cloud service providers.
8Frequently Asked Questions
| question | answer |
|---|---|
| Is a company risky if its free cash flow is negative? | It is difficult to make such a definitive conclusion during the investment phase. This is because it takes several quarters for data centers to generate revenue after capital is invested. A warning sign emerges when the growth of cloud operating profit slows down alongside negative free cash flow. |
| Isn't Microsoft's contract balance thanks to OpenAI? | According to the company's explanation, even excluding OpenAI, the commercial sector's RPO increased by 25% year-over-year, and the increase from the previous quarter came from customers other than frontier model vendors. While dependence on a single customer is an item that needs to be monitored, based solely on the current disclosure, the structure does not suggest that the growth is coming from only one source. |
| Why was Nvidia excluded from this comparison? | This is because Nvidia sells data center facilities rather than building them directly. Placing them on the same ranking table distorts the comparison due to differences in capital burden structures. Those who sell equipment and those who directly build and operate it must be viewed separately. |
Conclusion — It is now time to look at capital efficiency rather than the number of GPUs.
While there is frequent talk that AI capital expenditures are nearing their peak, none of the five companies have reduced their investments in 2026. Instead, differences have widened among the companies regarding the cash flow supporting those investments. While Microsoft more than doubled its capital expenditures in two years, it also increased its operating cash flow from $118.5 billion to $182.9 billion. Amazon and Oracle have entered a phase where they can no longer maintain their current pace relying solely on their own cash.
Therefore, when looking at Big Tech earnings going forward, a single line regarding capital expenditure amounts is insufficient. I intend to continuously track four factors: how high the ratio of capital expenditure to operating cash rises, whether the growth in cloud operating profit keeps pace with the growth in capital expenditure, how quickly contract balances convert into actual revenue and cash, and whether those investment costs are covered by internal cash or if the proportion of bonds, leases, stock issuances, and customer prepayments increases.
This series began with prices. Next, we looked at long-term interest rates and the government bond market, and subsequently followed the capital investment and financing of AI companies. This time, we examined how that money is actually being used. It is too early to pick a winner at this stage. Nevertheless, the next question to consider has become clear: when and how much should this invested money generate? Ultimately, the issue of expensive capital depends not on whether one can borrow money, but on whether one can earn more than the cost of borrowing with that money.
All figures and analyses in this article are for informational purposes only and do not constitute investment advice. The ratios presented are values calculated internally based on each company's disclosures (10-K, quarterly reports, and earnings announcements); however, the periods may not perfectly align as Microsoft and Oracle use fiscal years, while the other three use calendar years. The 2026 figures are intended to identify market trends rather than compare rankings, as they include a mix of fiscal years, first-half periods, and the past 12 months for each company. Amazon's capital expenditure over the past 12 months is an approximation calculated backward from the announced figures. You bear full responsibility for any investment decisions or liabilities regarding the companies mentioned.
📌 Was this analysis helpful?
In the next post, I plan to cover “How much does it take to break even with AI investment — the hurdle rate in the era of 5% interest rates.”
We continuously track expensive capital and AI investment cycles. Receive notifications so you don't miss out.
Subscribe and get notifications →How this content was produced
Aleph's research AI agent assisted with collecting and analyzing public data, creating charts and visuals, and structuring the draft. Davar personally reviewed and edited the sources, figures, reasoning, and final conclusions.
This content is for informational purposes only and is not personalized investment advice or an individual stock recommendation. Read the full disclaimer

Davar
Davar builds and operates Aleph's research AI agent and writes and reviews analysis on macroeconomic developments and AI industry trends.
© Aleph. All rights reserved.